
Last Updated on March 8, 2026 by Craig Allen Keefner
Where Kiosks, Digital Signage & Unattended Retail Deliver ROI
We are constantly asked. “Where does self-service technology these days benefit the retailer and the customer.
Self-service technology has moved far beyond simple ticketing or check-in. In 2025–2026, the strongest growth is coming from multi-modal automation ecosystems — kiosks, digital signage, vending, AI-driven POS, smart lockers, and cloud analytics. Across The Industry Group network, we consistently see a blend of labor efficiency, higher throughput, and better customer experience driving adoption.
Below is a breakdown of the top-performing verticals, why they’re surging, and where OEMs, integrators, and operators should focus for the highest return.
Top Verticals Overview (2025–2026)
1. QSR & Fast Casual Restaurants
Demand for kiosks, menu boards, AI-ordering, and pickup lockers continues to outpace all other sectors. Upsell automation alone drives some of the fastest ROI.
2. Grocery & Retail
Shrink reduction, returns automation, and BOPIS/locker fulfillment dominate the investment cycle.
3. Healthcare & Patient Intake
Staffing gaps + regulatory pressure = explosive growth for check-in, ID verification, and wayfinding kiosks. Healthcare is huge for EV charging stations.
4. Hospitality & Travel
Airlines, hotels, and attractions aim for higher throughput and fast smooth “memorable” guest journeys.
5. Amusement, Attractions & Entertainment
IAAPA’s strongest segment: ticketing, photo capture, F&B kiosks, digital signage, and smart lockers.
| Vertical | Key Use Cases | Primary Tech | ROI Strength |
|---|---|---|---|
| QSR & Fast Casual | Self-ordering, menu boards, pickup lockers | Kiosks, AI ordering, POS, digital signage | ★★★★★ |
| Grocery & Retail | SCO, returns, BOPIS lockers, endless aisle | Kiosks, lockers, signage, vision systems | ★★★★★ |
| Healthcare | Patient check-in, ID verify, wayfinding | Kiosks, secure payments, signage, queueing | ★★★★☆ |
| Hospitality & Travel | Hotel check-in, ticketing, bag tag | Kiosks, signage, POS, credentialing | ★★★★☆ |
| Amusement & Attractions | Ticketing, photo, F&B, lockers | Kiosks, digital signage, RFID lockers | ★★★★☆ |
| Gaming & Casinos | TITO, loyalty, sports betting, cage automation | Secure kiosks, AML/KYC, signage | ★★★★★ |
| Transportation & Smart City | EV/parking, transit ticketing, permits | Kiosks, chargers, signage, payments | ★★★☆☆ |
| Parcel & Last-Mile Logistics | Returns, package pickup, refrigerated lockers | Smart lockers, kiosks, RFID | ★★★★☆ |
| Financial Services | ATM, bill pay, cash-to-card | Kiosks, POS terminals, ID verify | ★★★☆☆ |
What About Government?
Government and Public Sector organizations have been steady adopters of self-service technology for more than a decade, driven by the need to improve citizen access, reduce staffing pressure, and standardize service delivery across large and diverse populations. While procurement cycles are often longer than in commercial markets, deployments tend to be large-scale, long-lived, and mission-critical.
Common applications include DMV and licensing services, public benefits enrollment, courthouse payments and check-in, transit and municipal ticketing, public information kiosks, libraries, and corrections-related communications. In many jurisdictions, kiosks serve as a primary access point for services that would otherwise require in-person staffing, particularly in rural or underserved areas.
Government kiosk projects place heavy emphasis on accessibility (ADA compliance), security, data privacy, and reliability. Unlike consumer-grade retail deployments, public-sector kiosks are typically expected to operate for many years with minimal downtime, making serviceability, remote management, and vendor support especially critical.
While some government use cases overlap with Transportation, Smart City, and Healthcare verticals, public-sector deployments remain a distinct category due to their regulatory requirements, funding structures, and scale. For manufacturers, integrators, and software providers with experience in compliance-driven environments, Government & Public Sector continues to be a stable and strategically important vertical for self-service technology.
Why Government & Public Sector Is Not Ranked by ROI
Unlike commercial verticals such as QSR, retail, or grocery, Government and Public Sector deployments are not typically driven by direct revenue or transaction-based ROI. Success is measured instead by service access, compliance, cost containment, wait-time reduction, and citizen satisfaction, rather than incremental sales or labor displacement.
In addition, public-sector projects often involve multi-year procurement cycles, grant-based funding, and policy mandates, making ROI difficult to compare on an apples-to-apples basis with private-sector deployments. For these reasons, Government & Public Sector is included as a strategic deployment vertical, but not ranked alongside revenue-driven industries.
So what about kiosk market share and growth?
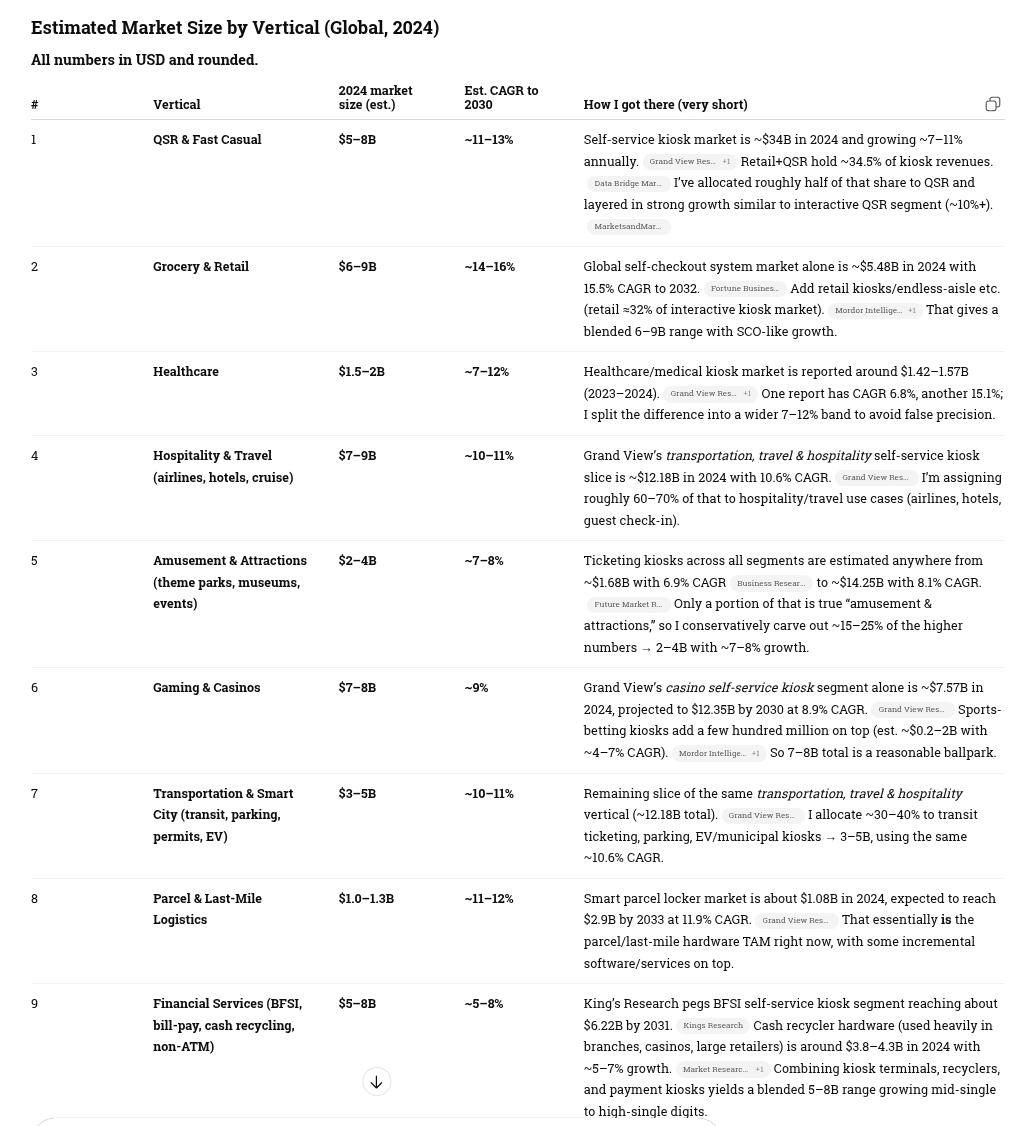
Click for full size — kiosk market share by vertical with growth
Ok — What About Self-Service Overall? Let the Big Dog Eat!
If we naïvely add the midpoints we get ≈$210B global spend in 2024 across the stack. That overstates true TAM because:
-
POS is used in many non–self-service scenarios.
-
Kiosks and vending often embed POS and sometimes digital signage displays.
-
Conversational AI runs both on self-service endpoints and on contact-centre / web channels.
The global self-service technology stack—kiosks, POS, digital signage, smart vending, and conversational AI—sits in the $150–200B range today, with blended high-single-digit growth and pockets of >20% CAGR where AI is involved.
Roughly 60%+ of global self-service technology spend is concentrated in Retail + QSR, with another ~20% across travel/hospitality, transportation, and gaming, and the remaining 15–20% spread across healthcare, parcel, BFSI, and attractions.
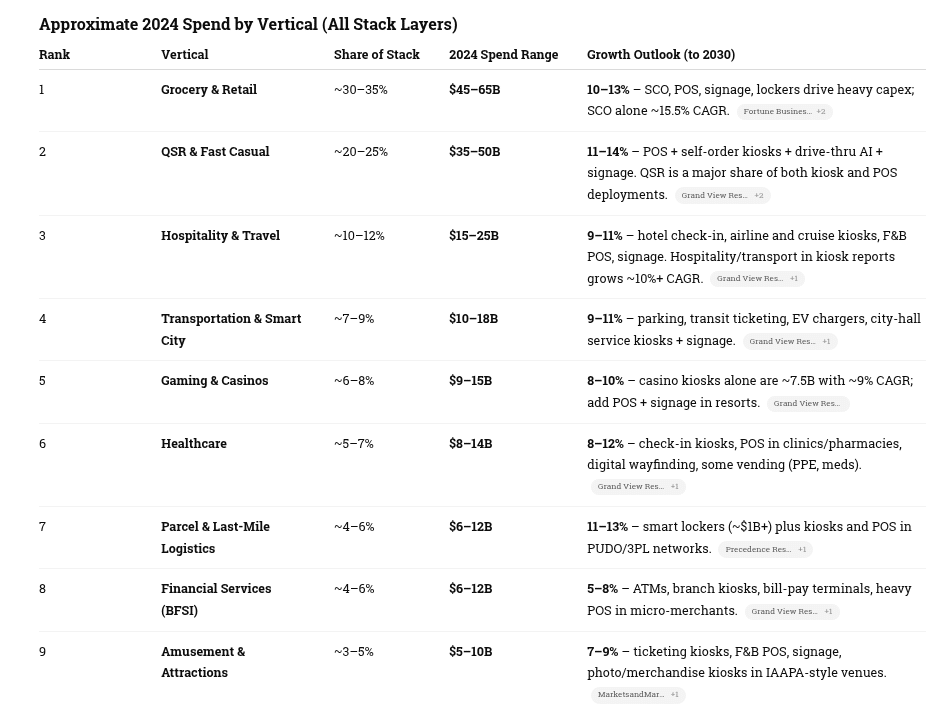
Click for full size — Overall self-service technology market and growth
Service…Did Someone Say Service?
1. High-Level Summary (Global, 2024)
Global service + warranty value across all self-service technology:
👉 Estimated $27–34 Billion per year
Broken down as:
-
Service / Maintenance: ~$21–27B
-
Extended Warranty: ~$6–7B
This scales with installed base growth, not new hardware shipments — which is the right way to model it.
2. How the Service/Warranty Market Works
For nearly all categories, service contracts fall into predictable ranges:
| Segment | Typical Service Cost Per Endpoint | Warranty/Extended Warranty |
|---|---|---|
| Kiosks | 8–12% of hardware value annually | 8–12% of hardware value per year |
| POS (fixed & mobile) | 12–18% annually | Often bundled, 8–12% per year |
| Digital Signage | 6–12% annually | 5–8% per year |
| Smart Vending | 12–20% annually | 10–12% per year |
| Smart Lockers | 10–14% annually | 8–10% per year |
| Conversational AI endpoints | 20–30% annually (software support) | Mostly software subscription |
These are the ratios I used to model global value.
3. The Big Calculation: Installed Base × Service Ratios
This is where the market really lives.
Below is a breakdown by technology class.
A. Interactive & Self-Service Kiosks
-
Installed base (global): 13–16 million units
-
Avg hardware cost: $3,000–8,000
-
Annual service/warranty spend:
≈ $6–8B
Includes:
-
Field service
-
RMA
-
Preventive maintenance
-
Remote monitoring
-
Software support
-
Onsite labor
B. Digital Signage
-
Installed base: >100 million screens (retail, QSR, transportation, OOH)
-
Annual service envelope:
≈ $5–7B
Breakdown:
-
Device monitoring
-
CMS support
-
Onsite swap
-
Calibration
-
Network connectivity / bandwidth mgmt.
Signage is huge because the screens are everywhere, even if per-device contracts are smaller.
C. POS Terminals (fixed + mobile)
-
Installed base: 140–180 million terminals
-
ASP service: $40–120 per terminal annually
-
Total service value:
≈ $8–10B
POS is by far the largest installed base of any self-service-related category, which drives a massive recurring MSP/ISO/VAR ecosystem.
D. Smart / Intelligent Vending
-
Installed base: 18–25 million machines
-
Annual service (highest ratio of all):
≈ $3–4B
Why so high?
-
Vending requires cleaning, replenishment, cash handling, refrigeration, robotics, etc.
-
Many operators outsource maintenance.
-
AI/smart vending pushes the service premium even higher.
E. Smart Lockers / Parcel Terminals
-
Installed base: 3–4 million units (global)
-
Annual service value:
≈ $1.2–1.7B
High because lockers require:
-
Door mechanism maintenance
-
Networking
-
SLA-driven uptime (especially in retail & campus settings)
F. Conversational Voice / AI Endpoints
-
Installed base: 200–300 million devices (but only 2–3 million true commercial endpoints)
-
Annual support:
≈ $0.5–1B
This is small today but is the fastest-growing category because:
-
Drive-thru AI requires continuous tuning
-
Hospitality/retail voice kiosks require hosted AI models
-
Contact center AI endpoints bleed into kiosk endpoints
Expect 20–30% CAGR for AI service contracts alone.
4. Market-Wide Total (All Categories)
Service + Warranty Market Size (Global, 2024)
| Category | Estimated Annual Value |
|---|---|
| Kiosks | $6–8B |
| Digital Signage | $5–7B |
| POS | $8–10B |
| Smart Vending | $3–4B |
| Smart Lockers | $1.2–1.7B |
| Conversational AI Endpoints | $0.5–1B |
| Total | $27–34B |
5. CAGR Outlook (Service Side Only)
Service and warranty grows slower than hardware except in AI.
| Category | Service CAGR Estimate (2024–2030) |
|---|---|
| Kiosks | 6–8% |
| Digital Signage | 7–9% |
| POS | 5–7% |
| Smart Vending | 11–13% |
| Smart Lockers | 10–12% |
| Conversational AI | 20–30% |
| Weighted Average | ~8–10% |
This means the global service market could reach:
$45–55B by 2030
The global service and warranty ecosystem surrounding self-service technology—kiosks, POS, digital signage, vending, lockers, and AI—is worth $27–34 billion annually, driven by the massive installed base of POS and digital signage and the high service intensity of kiosks and vending. By 2030 this will grow to $45–55 billion, with AI service contracts growing the fastest.
Grand Total — Global Self-Service Technology Market (2024)
👉 $180 Billion – $235 Billion per year
(Hardware + software + services + warranty + AI)
This is the correct “full stack” number for TIG/KMA positioning.
How the Total Breaks Down
A. Hardware + Software (core markets)
-
Interactive kiosks: $35B
-
Digital signage: $29B
-
Smart vending: $25B
-
POS terminals: $110B
-
Conversational AI software/platforms: $12B
Subtotal Hardware + Software = $150B – $185B
(Range reflects overlap, especially POS–kiosk–signage.)
B. Service + Warranty (attached value across all markets)
-
Kiosks: $6–8B
-
Digital signage: $5–7B
-
POS: $8–10B
-
Smart vending: $3–4B
-
Lockers: $1.2–1.7B
-
Conversational AI support: $0.5–1B
Subtotal Services + Warranty = $27B – $34B
GRAND TOTAL (A + B):
🎯 $180B – $235B Total Global Self-Service Ecosystem (2024)
We’ll stop there for now…
{
“@context”: “https://schema.org”,
“@graph”: [
{
“@type”: “WebPage”,
“@id”: “https://kioskindustry.org/best-verticals-self-service-technology/#webpage”,
“url”: “https://kioskindustry.org/best-verticals-self-service-technology/”,
“name”: “Best Verticals for Self-Service Technology”,
“isPartOf”: {
“@id”: “https://kioskindustry.org/#website”
},
“about”: [
{
“@id”: “https://kioskindustry.org/#selfservice”
},
{
“@id”: “https://kioskindustry.org/#kiosks”
},
{
“@id”: “https://kioskindustry.org/#verticals”
}
],
“primaryImageOfPage”: {
“@id”: “https://kioskindustry.org/media/selfservice-verticals-hero/#primaryimage”
},
“datePublished”: “2025-02-01T08:00:00-07:00”,
“dateModified”: “2025-02-01T08:00:00-07:00”,
“description”: “A comprehensive analysis of the strongest verticals for self-service technology including kiosks, digital signage, vending, smart lockers, POS, and unattended retail in 2025–2026.”,
“breadcrumb”: {
“@id”: “https://kioskindustry.org/best-verticals-self-service-technology/#breadcrumb”
}
},
{
“@type”: “WebSite”,
“@id”: “https://kioskindustry.org/#website”,
“url”: “https://kioskindustry.org/”,
“name”: “Kiosk Industry”,
“publisher”: {
“@id”: “https://kioskindustry.org/#organization”
},
“potentialAction”: {
“@type”: “SearchAction”,
“target”: “https://kioskindustry.org/?s={search_term_string}”,
“query-input”: “required name=search_term_string”
}
},
{
“@type”: “Organization”,
“@id”: “https://kioskindustry.org/#organization”,
name”: “Kiosk Industry Group”,
“url”: “https://kioskindustry.org”,
“logo”: {
“@type”: “ImageObject”,
“url”: “https://kioskindustry.org/wp-content/uploads/kiosk-industry-logo.png”,
“width”: 512,
“height”: 512
},
“contactPoint”: {
“@type”: “ContactPoint”,
“contactType”: “editorial”,
“email”: “[email protected]”,
“telephone”: “+1-720-324-1837”
}
},
{
“@type”: “BreadcrumbList”,
“@id”: “https://kioskindustry.org/best-verticals-self-service-technology/#breadcrumb”,
“itemListElement”: [
{
“@type”: “ListItem”,
“position”: 1,
“item”: {
“@id”: “https://kioskindustry.org/”,
“name”: “Home”
}
},
{
“@type”: “ListItem”,
“position”: 2,
“item”: {
“@id”: “https://kioskindustry.org/best-verticals-self-service-technology/”,
“name”: “Best Verticals for Self-Service Technology”
}
}
]
},
{
“@type”: “ImageObject”,
“@id”: “https://kioskindustry.org/media/selfservice-verticals-hero/#primaryimage”,
“url”: “https://kioskindustry.org/wp-content/uploads/2025/02/selfservice-verticals-hero.png”,
“width”: 1600,
“height”: 900,
“caption”: “Best Verticals for Self-Service Technology”
},
{
“@type”: “Article”,
“@id”: “https://kioskindustry.org/best-verticals-self-service-technology/#article”,
“headline”: “Best Verticals for Self-Service Technology in 2025–2026”,
“articleSection”: “Industry Analysis”,
“wordCount”: 950,
“author”: {
“@type”: “Person”,
“name”: “Craig Keefner”,
“url”: “https://kioskindustry.org/about-kioskindustry/”
},
“publisher”: {
“@id”: “https://kioskindustry.org/#organization”
},
“image”: {
“@id”: “https://kioskindustry.org/media/selfservice-verticals-hero/#primaryimage”
},
description”: “Analysis of the top-performing verticals for kiosks, digital signage, smart lockers, vending, POS, and unattended retail, including QSR, retail, healthcare, hospitality, travel, gaming, and logistics.,
“datePublished”: “2025-02-01T08:00:00-07:00”,
“dateModified”: “2025-02-01T08:00:00-07:00”,
“isPartOf”: {
“@id”: “https://kioskindustry.org/#website”
},
“mainEntityOfPage”: {
“@id”: “https://kioskindustry.org/best-verticals-self-service-technology/#webpage”
}
},
{
“@type”: “ItemList”,
“@id”: “https://kioskindustry.org/best-verticals-self-service-technology/#vertical-list”,
“name”: “Top Verticals for Self-Service Technology”,
“itemListOrder”: “Descending”,
“itemListElement”: [
{
“@type”: “ListItem”,
“position”: 1,
“item”: {
“@type”: “Service”,
“name”: “QSR & Fast Casual Restaurants”,
“description”: “Self-order kiosks, menu boards, drive-thru AI, and pickup lockers driving top-tier ROI.”
}
},
{
“@type”: “ListItem”,
“position”: 2,
“item”: {
“@type”: “Service”,
“name”: “Grocery & Retail”,
“description”: “SCO, returns automation, digital signage, and BOPIS lockers reducing shrink and labor friction.”
}
},
{
“@type”: “ListItem”,
“position”: 3,
“item”: {
“@type”: “Service”,
“name”: “Healthcare”,
“description”: “Patient intake kiosks, ID verification, queueing, and wayfinding driven by staffing shortages.”
}
},
{
“@type”: “ListItem”,
“position”: 4,
“item”: {
“@type”: “Service”,
“name”: “Hospitality & Travel”,
“description”: “Hotel check-in kiosks, airline self-tagging, digital signage, and unattended retail.”
}
},
{
“@type”: “ListItem”,
“position”: 5,
“item”: {
“@type”: “Service”,
“name”: “Amusement & Attractions”,
“description”: “Ticketing kiosks, F&B ordering, RFID lockers, and guest throughput automation.”
}
},
{
“@type”: “ListItem”,
“position”: 6,
“item”: {
“@type”: “Service”,
“name”: “Gaming & Casinos”,
“description”: “TITO kiosks, loyalty enrollment, AML/KYC, digital signage, and cash automation.”
}
},
{
“@type”: “ListItem”,
“position”: 7,
“item”: {
“@type”: “Service”,
“name”: “Transportation & Smart City”,
“description”: “Transit ticketing, EV charging kiosks, parking payments, city service automation.”
}
},
{
“@type”: “ListItem”,
“position”: 8,
“item”: {
“@type”: “Service”,
“name”: “Parcel & Last-Mile Logistics”,
“description”: “Return kiosks, smart lockers, refrigerated pickup, and carrier-agnostic hubs.”
}
},
{
“@type”: “ListItem”,
“position”: 9,
“item”: {
“@type”: “Service”,
“name”: “Financial Services”,
“description”: “ATM, bill pay, cash conversion, and POS terminals with high compliance requirements.”
}
}
]
},
{
“@id”: “https://kioskindustry.org/#selfservice”,
“@type”: “Thing”,
“name”: “Self-Service Technology”
},
{
“@id”: “https://kioskindustry.org/#kiosks”,
“@type”: “Thing”,
“name”: “Kiosks”
},
{
“@id”: “https://kioskindustry.org/#verticals”,
“@type”: “Thing”,
“name”: “Self-Service Verticals”
}
]
}


