
Last Updated on December 9, 2025 by Craig Allen Keefner
Where has all my money gone – long time passing — Pete Seeger
Another article on how much customers steal at Self-Checkout is trending, primarily based on Lending Tree report. Theft in retail — is it customers, employees, shoplifters or process and control? Looks like it is all of the above. Interesting that SCOs actually improve all of those factors, despite people forgetting to scan or deliberately stealing.
What are the sources of theft?
retail theft
What the survey found
-
27% of self-checkout users admit intentionally taking an item without scanning it — a big jump from 15% in 2023. LendingTree+1
-
36% say they’ve accidentally left with an unscanned item; of that group, 61% kept the item. LendingTree
-
Demographics: Among those who admitted to intentional theft, the most likely groups were:
-
Ages 29–44 (Millennials): 41% LendingTree
-
Ages 18–28 (Gen Z): 37% LendingTree
-
Households earning six figures: 40% LendingTree
-
Men were more than twice as likely as women (38% vs. 16%) to admit stealing. LendingTree+1
-
🧭 Why people say they do it
When asked about motivations:
-
47% cited essentials being unaffordable as a driver. LendingTree
-
46% blamed rising prices tied to tariffs. LendingTree
-
39% said prices just “feel unfair or too high.” LendingTree
Of those who said they’d steal again, 60% said they’d likely take essentials such as food, water, or healthcare items. LendingTree
💡 What people think about self-checkout
-
55% of Americans like self-checkout for speed and convenience. LendingTree
-
But 69% of self-checkout users believe these systems make it easier to steal. LendingTree
-
Among older users, concern is higher: 77% of Baby Boomers and 70% of Gen Xers believe self-checkout encourages theft. LendingTree
Also, 35% of users say they’ve witnessed someone steal at self-checkout. Of those, 42% reported the incident. LendingTree
✅ Author’s (and LendingTree’s) take
The report — written by LendingTree’s chief consumer-finance analyst — argues that self-checkout “provides a potential opportunity for folks to help themselves,” especially under financial pressure; but they emphasize that stealing is wrong and suggest alternatives like seeking community help or exploring debt-consolidation or loan-refinancing options
Current industry numbers
Recent National Retail Federation (NRF) security surveys attribute about 36% of shrink to external theft (shoplifting plus organized retail crime) and about 29% to internal employee theft, with the rest from process errors and other causes. Other analyses and vendor summaries generally put employee theft around 28–30% of shrink and customer/ORC theft in the mid‑30% range, reinforcing that external theft is the larger bucket on average in current U.S. data.
Customer vs employee theft
External theft tends to involve more incidents at lower value per event, while internal theft incidents are less frequent but higher dollar per case, often around four times larger per investigated incident. Some studies and older surveys have found periods where employee theft exceeded shoplifting as a share of shrink, but more recent NRF data show customer/ORC theft modestly ahead overall. Sector, format, and controls matter a lot: for example, high‑value, low‑supervision environments (like some specialty or back‑room operations) can have employee theft that rivals or exceeds customer theft, while high‑traffic mass merchants feel more of the shoplifting/ORC pressure.
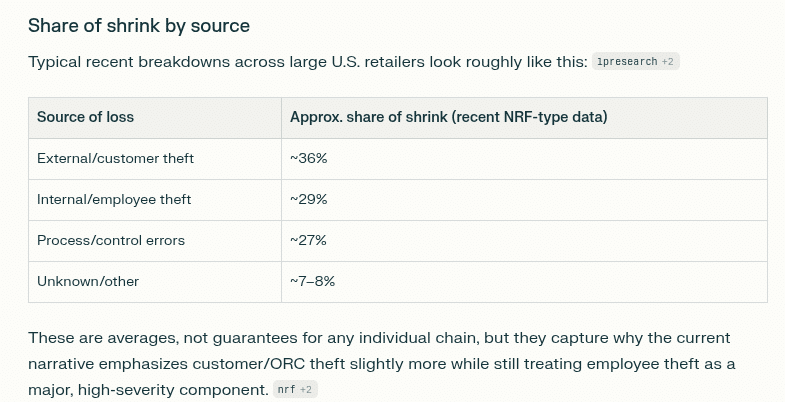
Share of shrink by source
Typical recent breakdowns across large U.S. retailers look roughly like this:
| Source of loss | Approx. share of shrink (recent NRF-type data) |
|---|---|
| External/customer theft | ~36% |
| Internal/employee theft | ~29% |
| Process/control errors | ~27% |
| Unknown/other | ~7–8% |


