Last Updated on August 6, 2026 by Craig Allen Keefner
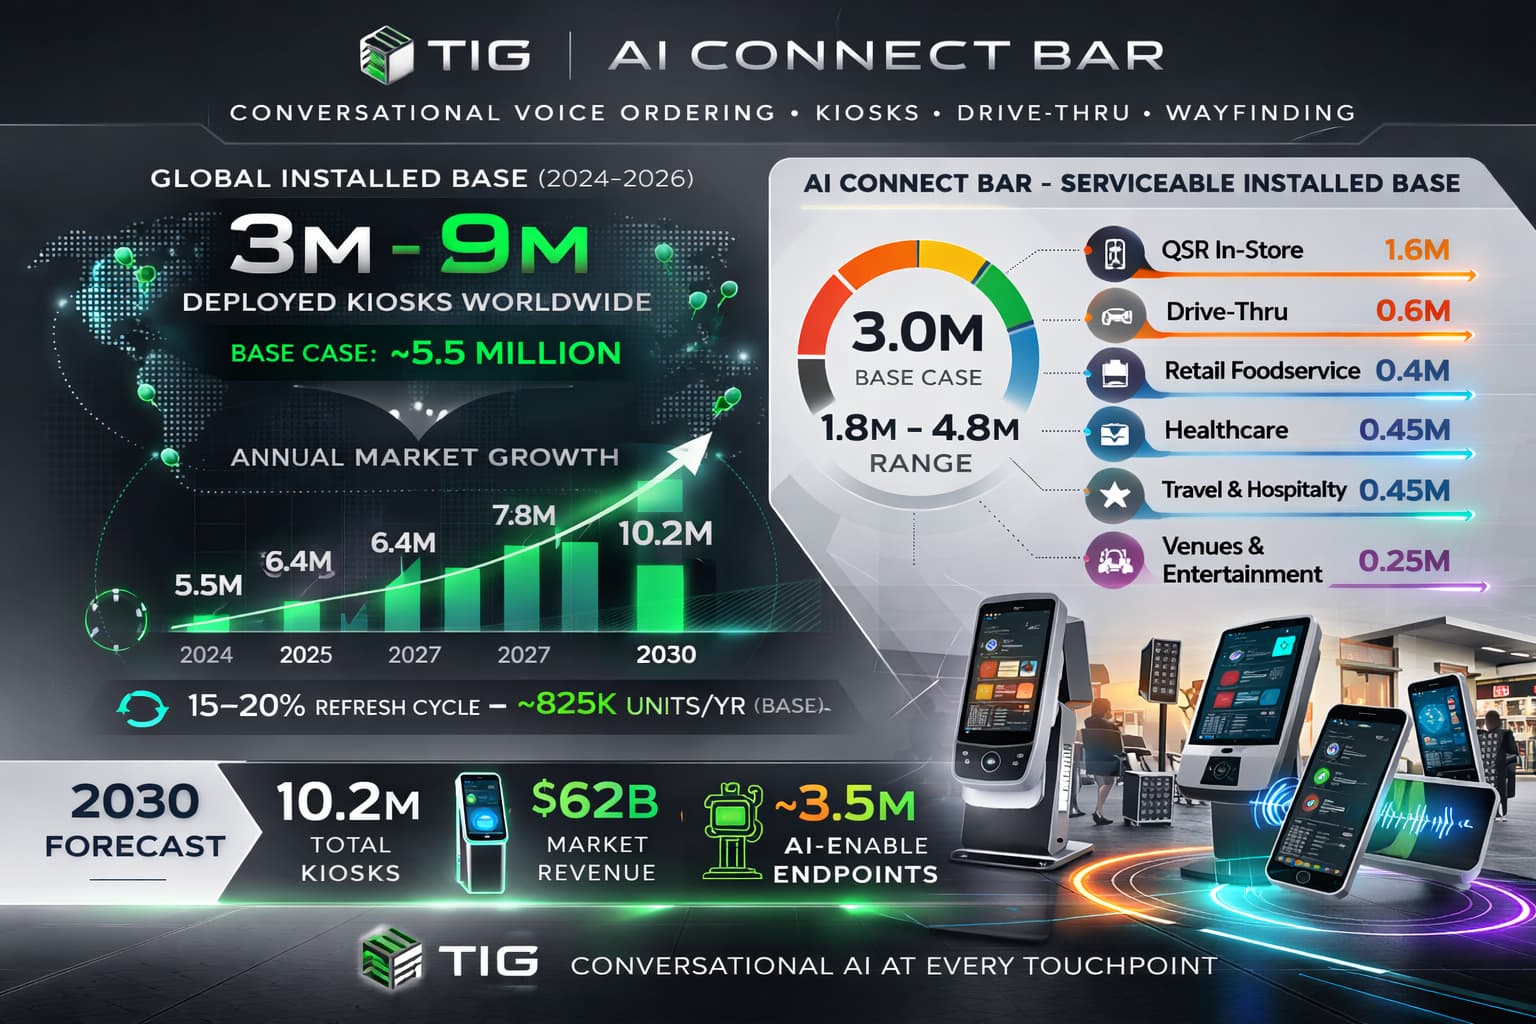
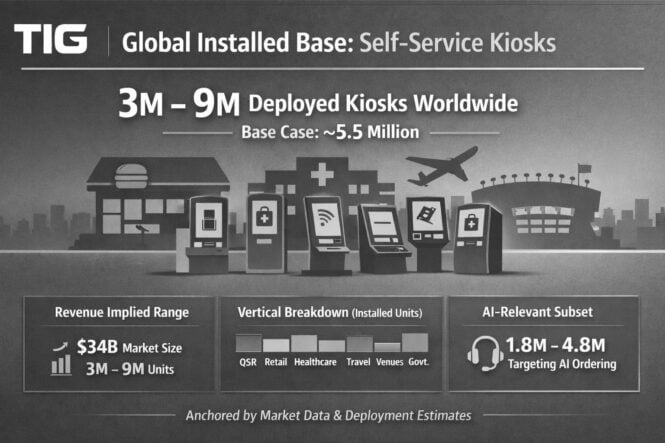
The global self-service technology market, which includes hardware, software, services, warranty, and AI, is estimated to be between $180 billion and $235 billion annually in 2024. The interactive kiosk market specifically is projected to grow from $34.79 billion in 2024 to $52.74 billion by 2030, with a compound annual growth rate (CAGR) of approximately 7.2%. Kiosk Industry also estimates a global installed base of 3 million to 9 million deployed kiosks worldwide between 2024 and 2026.
How Big Is The Self-Service Market?
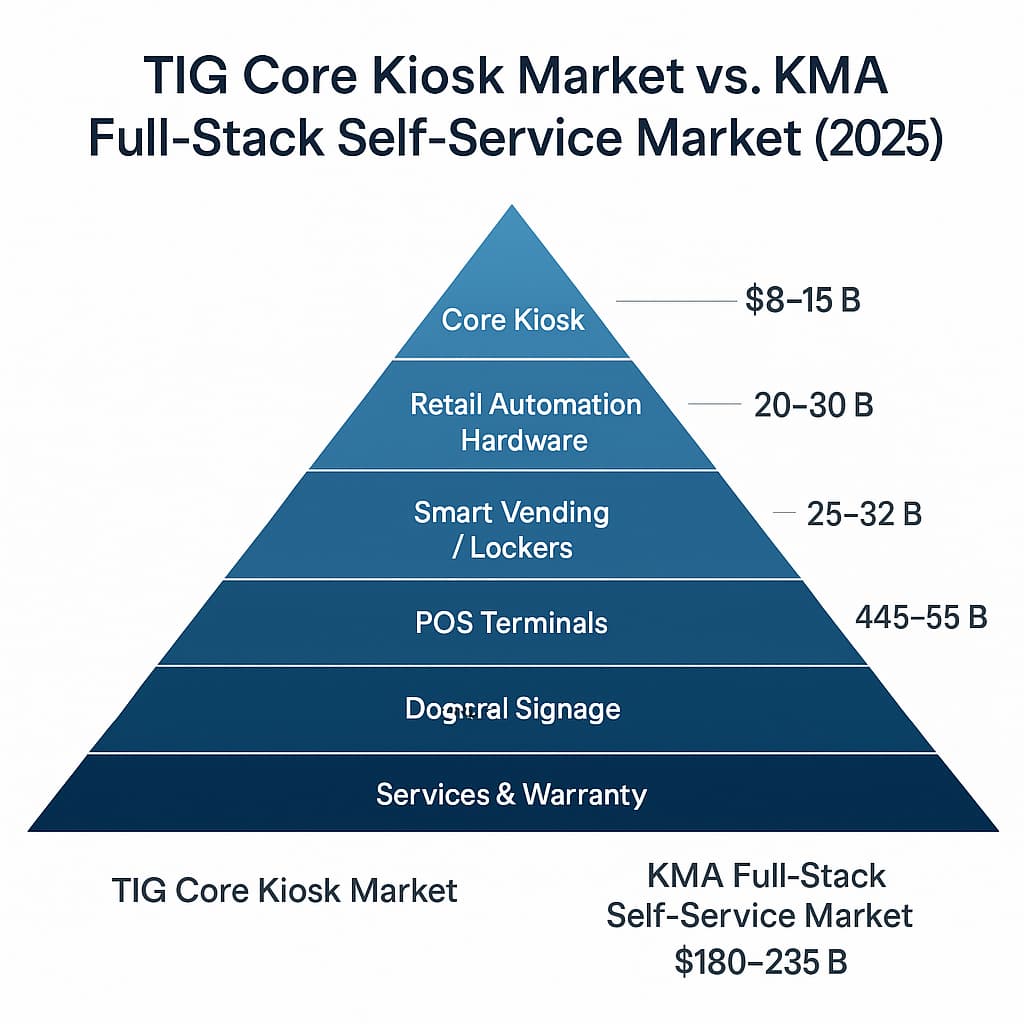
In 2025 December we looked at Self-Service market as a whole. Here is summary of that —
TIG Core Market Report.jpg
Grand Total — Global Self-Service Technology Market (2024)
- 180 Billion – $235 Billion per year]
- Hardware + software + services + warranty + AI
- This is the correct “full stack” number for TIG/KMA positioning.
It’s 2026, lets take another look, in another way. One of our supporters asked TIG about it and its a good time to issue 2026.
Kiosks (global revenue market)
These sources are broadly consistent that kiosks are already a ~$30B+ market and grow to ~$45B–$63B by ~2030, depending on definition (interactive kiosks vs self-service kiosks, what’s included in services/software, etc.).
-
Interactive kiosk market: $34.79B (2024) → $52.74B (2030) (CAGR ~7.2%).
-
Self-service kiosk market: $34.36B (2024) → $62.46B (2030) (CAGR ~10.9%).
-
Another widely cited forecast band: $21.85B (2025) → $35.65B (2030) (CAGR ~10.3%).
-
2026→2031 view (helpful if you want a near-term “5-year plan” slide): $16.24B (2026) → $28.41B (2031) (CAGR ~11.84%).
Touchscreens / interactive displays (the commercial side)
This is where some numbers often go off the rails because some “touchscreen display market” numbers include phones/tablets (not what we muan). For our use case, we want commercial touch displays / interactive displays (retail, hospitality, healthcare, kiosks, education, etc.).
-
Commercial touch display market: around $6.9B (2025) → $16.3B (2035) (CAGR ~9%).
-
Another “commercial touch display” estimate shows $6.42B (2025) → $12.57B (2033) (CAGR ~8.75%).
-
Interactive display market (broader than just touch panels; often includes solutions): $48.70B (2024) → $90.68B (2032).
-
Cautionary example (too broad for your deck unless you explicitly say it includes consumer devices): Touch Screen Display market $76.36B (2023) → $194.44B (2032).
Global installed base (already deployed): defensible range
Anchor (2024–2026 timeframe)
Multiple major market trackers put the self-service/interactive kiosk revenue market in the ~$34B neighborhood for 2024.
Convert revenue → implied installed base (triangulation)
A kiosk “in the field” carries an annualized cost stack (capex amortization + software + support):
-
Capex amortized: (typical $10k–$30k all-in kiosk system) / (5–7 years)
-
Plus annual: software/licenses + connectivity + support/service
A conservative, investor-friendly all-in annualized spend per deployed kiosk is:
-
Low spend case: $4k / kiosk-year (cheaper hardware, light support)
-
High spend case: $10k / kiosk-year (payments, printers, managed services, higher uptime SLAs)
So implied installed base:
-
Low base (fewer kiosks, higher spend): $34B / $10k ≈ 3.4M kiosks
-
High base (more kiosks, lower spend): $34B / $4k ≈ 8.6M kiosks
Defensible installed base range (global): ~3–9 million deployed kiosks
A good “base case” midpoint for a pitch deck: ~5.5M.
This range is defensible because it’s constrained by a public revenue anchor (kiosk market size) and uses transparent unit economics rather than unverifiable “we think there are X kiosks” claims.
Bottom-up “sanity check” by vertical (ranges, not precision theater)
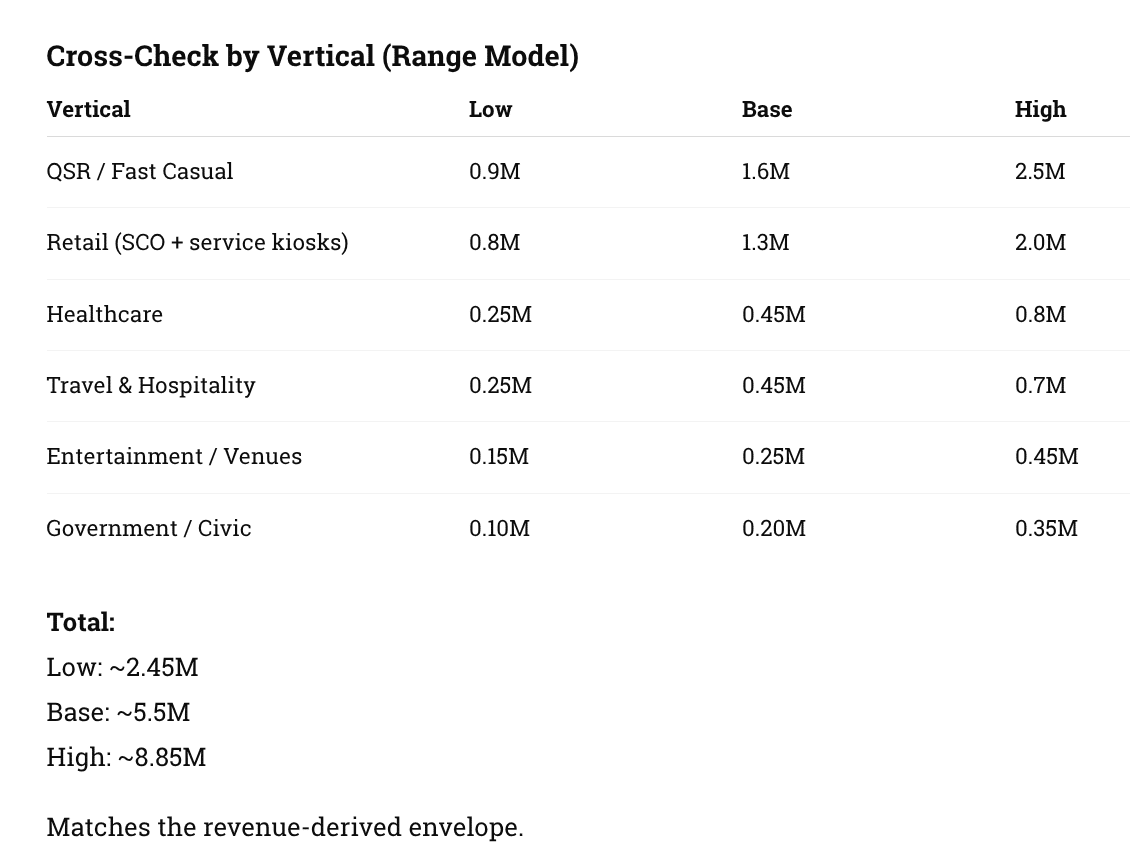
These are ranges we show as a banded bar chart (low/base/high). They’re designed to sum to the 3–9M triangulated envelope.
Suggested vertical split of deployed kiosks (global, already deployed)
QSR / Fast Casual ordering & pickup: 0.9M – 2.5M
-
High site counts + multi-lane drive-thru + dining room ordering drives volume.
Retail (self-checkout + assisted checkout + loyalty/returns kiosks): 0.8M – 2.0M
-
Retail has huge footprint; endpoints can be “kiosk-like” lanes and interactive counters.
Healthcare (patient check-in/registration/wayfinding): 0.25M – 0.80M
-
Global hospital count is ~216k projected by 2026 (Statista via Newsweek); US hospitals ~6,100 (AHA) supports the magnitude.
Travel (airports, rail/metro ticketing, rental car, hotels): 0.25M – 0.70M
-
Airports/transport hubs are kiosk-dense even when venue counts are smaller.
Entertainment & venues (cinema ticketing, stadium/arena ordering, attractions): 0.15M – 0.45M
-
Global cinema screens are commonly estimated around ~40k screens; multiplex footprints imply meaningful kiosk deployments at venues. (Use as directional only.)
Government / civic (DMV, benefits, courts, libraries, municipal payments): 0.10M – 0.35M
-
Slower rollouts but large installed base across jurisdictions.
Total (low/base/high): ~2.45M / 5.50M / 8.85M
(Aligns tightly with the revenue-implied 3–9M envelope.)
What are the Evolving Scenarios for Self-Service Kiosks?
The evolving scenarios for self-service kiosks include new modalities beyond touchscreens, such as Conversational AI. For example, the Global Installed Base of Deployed Kiosks (2024–2026) is estimated at 3 – 9 Million Self-Service Kiosks Deployed Globally, with a Base Case of ~5.5 Million.
What about Conversational AI?
SLIDE 1
Global Installed Base of Deployed Kiosks (2024–2026)
Headline
3 – 9 Million Self-Service Kiosks Deployed Globally
Base Case: ~5.5 Million
How This Was Derived
Revenue Anchor:
Global self-service / interactive kiosk market ≈ $34B (2024)
Annualized kiosk-year economics:
-
Low case: ~$4,000 per deployed kiosk per year
-
High case: ~$10,000 per deployed kiosk per year
Implied installed base:
-
$34B ÷ $10K ≈ 3.4M
-
$34B ÷ $4K ≈ 8.6M
Rounded defensible envelope:
3M – 9M deployed kiosks worldwide
market research