
Last Updated on July 7, 2026 by Craig Allen Keefner
Need Some Numbers?

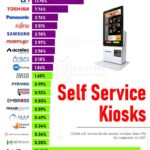
Kiosk Market latest prediction 2024 – click for full size
There are many reports with many numbers and most of them are from research data firms (India) trying to make a buck. We have seen good reports, bad reports, and even done our own reports. Frost and Sullivan did their due diligence way back when but that generation of genuine data providers has passed unfortunately. Here is what the Kiosk Industry Group will say.
August 2025 — R&M still calls it 44B but they doublecount and don’t research.
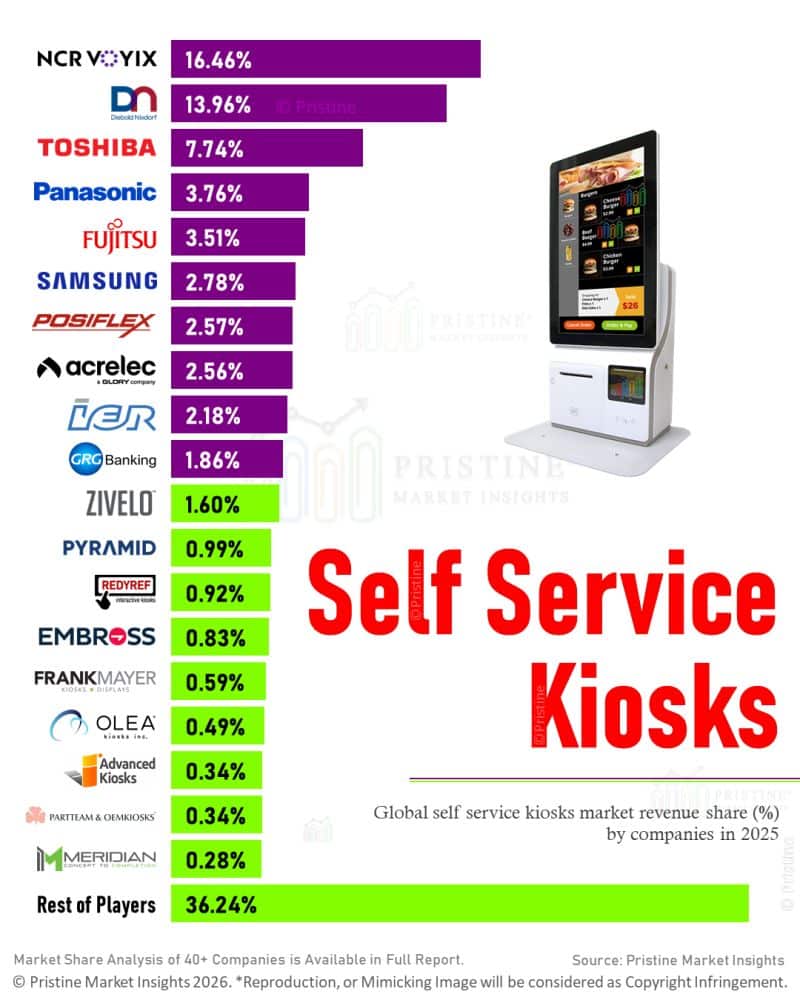
Market Size Estimates for 2026 and 2025
- 2026
- Prism Markets — Another datamart report which mixes up ATMs, SCOs and Kiosks along with old companies. No numbers provided.
Prism 2026 List
- 2026 Kiosk Market to Reach USD 52.2 Billion by 2031 Driven by Rising Demand for Self-Service Solutions — this is terrible report
- 2026 March Research and Markets Indian Datamart — The US interactive kiosk market is projected to grow from USD 6.79 billion in 2025 to USD 9.53 billion by 2030, at a CAGR of 7.0% during the forecast period. The growing deployment of interactive kiosks across retail, transportation, hospitality, financial services, healthcare, and government sectors is supporting market expansion in the US. Increasing preference for contactless and self-service technologies, along with widespread digital payment adoption, is driving kiosk installations across high-traffic and urban environments.
- 2026 Business Research Company — outdated information re-iterated.. $37.8B by 2030 with 7.9 CAGR
- Prism Markets — Another datamart report which mixes up ATMs, SCOs and Kiosks along with old companies. No numbers provided.
- Research and Markets
- 2026 March — The US interactive kiosk market is projected to grow from USD 6.79 billion in 2025 to USD 9.53 billion by 2030, at a CAGR of 7.0% during the forecast period. The growing deployment of interactive kiosks across retail, transportation, hospitality, financial services, healthcare, and government sectors is supporting market expansion in the US. Increasing preference for contactless and self-service technologies, along with widespread digital payment adoption, is driving kiosk installations across high-traffic and urban environments.
- Self-Service Kiosk Market June 2025 – Forecasts from 2025 to 2030 — USD 65.311 billion by 2030
- Note that R&M historically grades in D- level. In this report for example Subway is listed.
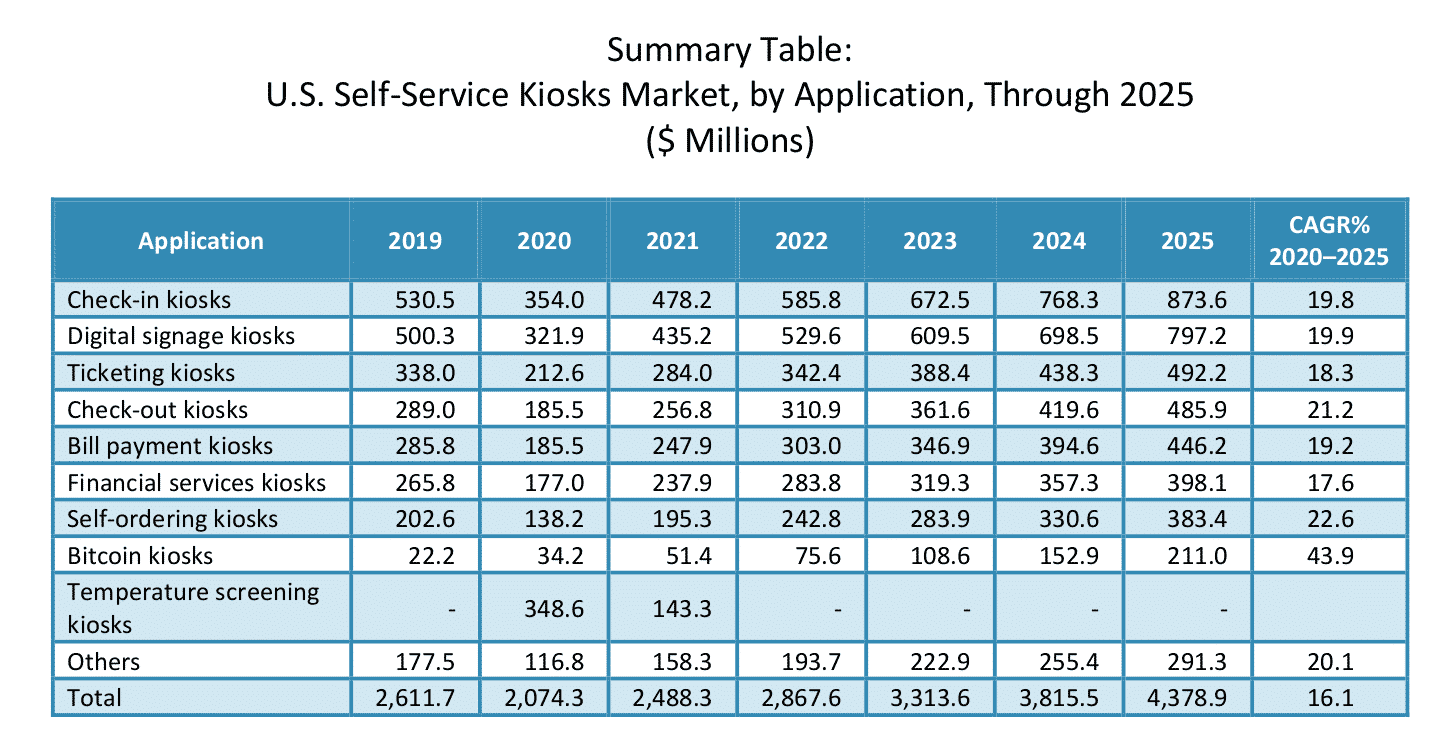
- In 2021, Research and Markets estimated the U.S. self-service kiosk market at $2.4 billion, projecting growth to $4.6 billion by 2026 at a 13.6% CAGR.
- For 2024, Research and Markets projected the global interactive kiosk market at $35 billion, with growth to $67.2 billion by 2033, representing a 7.5% CAGR
-
Straits Research: $29.08billion.straitsresearch
-
GlobeNewswire/ResearchAndMarkets: $36.06billion.globenewswire
- 2026 Business Research Company — outdated information reinterated.. $37.8B by 2030 with 7.9 CAGR
-
Mordor Intelligence: $34.16billion.mordorintelligence
-
MetaStat Insight: $36.08billion.metastatinsight
-
Market Research Company: $36.78billion.thebusinessresearchcompany
-
Market.us Scoop: $35billion (interactive only).scoop.market
-
Most reputable sources (excluding company press releases and studies with vague or inflated numbers) cluster in the $30billion–$37billion range globally for 2025.
The US market alone is usually cited at about $12–$15billion for interactive kiosks in 2025.
For 2024 — $16B is still a good number but remember that is a composite of several revenue/sale mechanisms. Support and service can easily be 25%. Software can easily be same or double or triple. Installation, shipping and logistics are always forgotten. You cannot take average cost of kiosk (e.g. $7,000) and divide that in 16B and get shipped units. Hopefully you don’t work in accounting (though possible).You can double count and triple count and quadruple count if you insist on biggest possible numbers. Or you can be reasonably accurate.
Databytes (here are some recent reports we like)
- SQUARE – future-of-restaurants-report-2024-edition-compressed
- CSTORES CTVG_TomorrowsCustomers_042424b-compressed
2024 Update — It’s interesting to see all the hiring and firing. Levels are up for both. Some thoughts:
- Rising demand
- More challenges – big super projects take a back seat to 3 at that restaurant and 3 at this one.
- More variants of self-service (lockers, robotics and POS are zooming)
- Tough for fat profit margins
- The declining market in China is causing those vendors to now look to US
- Other hotspots like Korea, Vietnam, Malaysia
- $16B is still a good number but remember that is a composite of several revenue/sale mechanisms. Support and service can easily be 25%. Software can easily be same. Installation, shipping and logistics are always forgotten. You cannot take average cost of kiosk (e.g. $5,000) and divide that in 16B and get shipped units. Hopefully you don’t work in accounting (though possible
If you are interested in what those $5000 reports being hawked over the internet are going to tell you, here is a sample from 2023. Internet scrape reports are not much different than get rich digital currency deals
Click for full size
Restaurant Industry Statistics
- Nice report is the POS Market Report for 2022 which lists many “application providers”
- Knowing the ecosystem of payment devices with people UCP Inc. and Datacap is highly recommended
- $799 billion: Restaurant industry sales in 2021, down $65 billion from 2019’s pre-pandemic levels
- 14.5 million: Restaurant industry employees at the end of 2021, down 1 million from pre-pandemic levels
- 90,000: Restaurant locations temporarily or permanently closed because of the pandemic
- 9 in 10 restaurants have fewer than 50 employees
- 7 in 10 restaurants are single-unit operations
- 8 in 10 restaurant owners started their industry careers in entry-level positions
- 9 in 10 restaurant managers started in entry-level positions
- Restaurants employ more minority managers than any other industry
- 41% of restaurant firms are owned by minorities – compared to 30% of businesses in the overall private sector.
- The waitstaff at full-service restaurants earns a median of $27.00 an hour, with the highest-paid group making $41.50 an hour and the lowest, $19.00 an hour.
- Our data is from the National Restaurant Association 2023 along with Nations Restaurant News. They keep each other fairly honest.
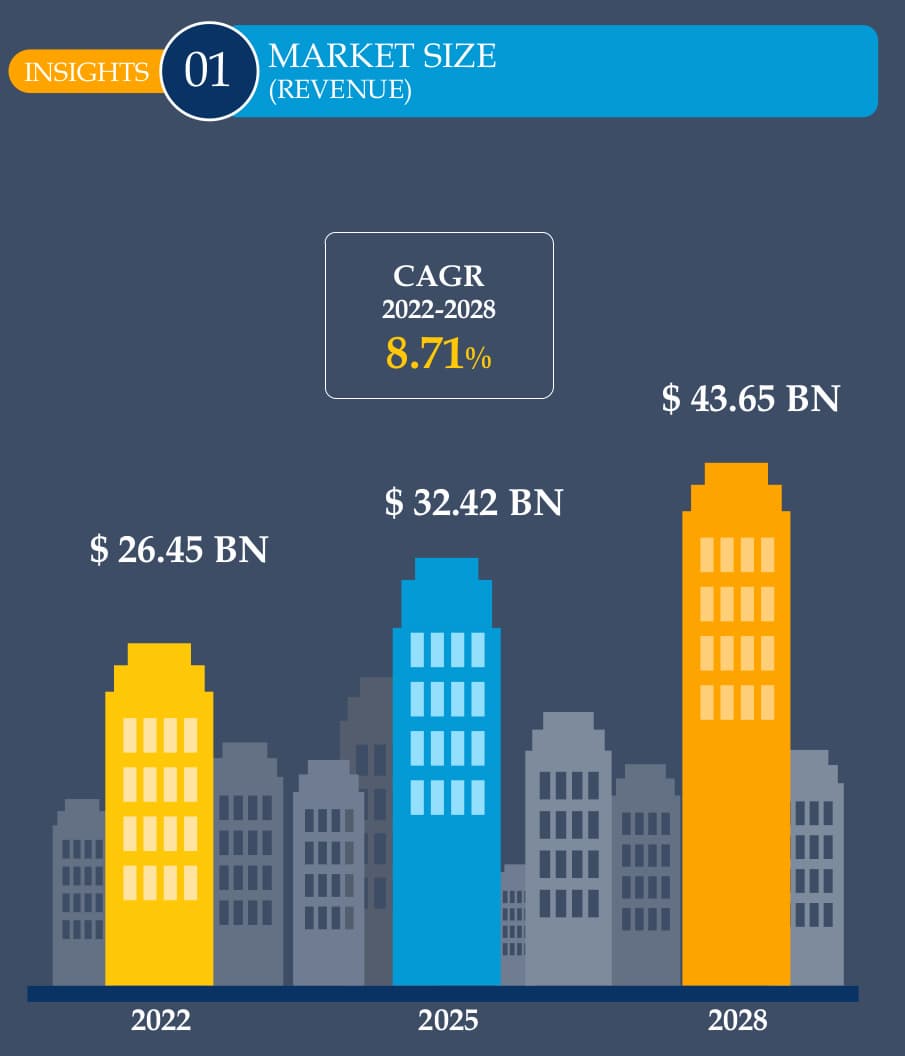
Our Past Predictions
Click for full size Bingo Card Predictions
2023
- The workforce shortage will continue and that will drive self-service options for customers.
- And even more so this year for employees and robotics are gaining traction.
- Face-enabled contactless transactions will easily triple
- The main media will always focus on high-value/high-click targets such as Walmart, Aldi, Krogers and Mcdonald’s
- New technology will become more widely available-to and deployed in small and medium and medium business. Cloud services help aggregate those offerings and become a viable distribution channel.
This post is continually updated..
Restaurant Kiosks, Self-Order Kiosks and McDonalds Kiosks – March 10, 2022 Viewpoint

Worldwide kiosks by region
There is always interest in metrics for restaurants and self-order despite being a somewhat saturated market at the top end (McDonalds, KFC, etc) and historically a low profit margin for kiosk manufacturers. The only advantage is having manufactured for Walmart is being totally prepared for manufacturing for McDonalds 🙂
It starts in North America and the number of restaurants McDonald’s has. And then Yum, and then another 400 or so. It gets problematic when you consider All In Ones (AIOs) or even ala carte ad hoc customer order systems such as Costco. Perhaps kiosks in function, but not in composition.
The chart to the right is a quick estimation based on a series of excel sheets drawn from corporate sites, NRN, NRF and others. Year over Year growth trends.
With a region like Asia, what about China? YUM is huge there. Just look at restaurants domestic and international.
| US | International | |
| KFC | 3943 | 21000 |
| Pizza Hut | 6561 | 11000 |
| Taco Bell | 6799 | 628 |
| Habit | 278 | 9 |
That was 2022 — How About 2025?
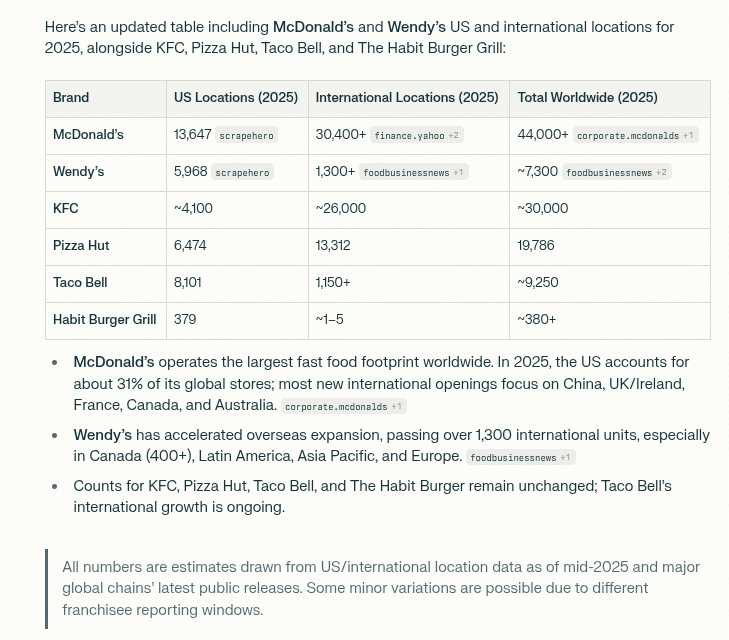
2025 restaurant count
Kiosk Market Data
- The US market alone is usually cited at about $12–$15billion for interactive kiosks in 2025.
- Latest from IndustryARC — expected to reach a valuation of USD 56.49 billion by 2031, growing at a steady CAGR of 7.1%. — Terrible list of participant profiles (only 6 players) — : KIOSK Information Systems Advantech Meridian Kiosks Hitachi SlabbKiosks – Kiosk Manufacturer & Distributor Kiosk Innovations Armagard REDYREF Interactive Kiosks PARTTEAM & OEMKIOSKS® SZZT ELECTRONICS CO.,LTD. Olea Kiosks Kiosk Kiosks
MetroClick ZYTRONIC Nanonation Protouch Qwick Media Inc. - Research and Markets November 2023 — These people from India are fairly persistent. Every two months they push another report. They have lowered their prices down to $2500
- Ironically they call out Vending Kiosks as the big segment though they never identify what a Vending kiosk actually is
- They expect Outdoor kiosks to outperform — that’s true
- Looks like they include SCOs, hybrids and ATMs given NCR and DN.
- Glory Limited does cash, not kiosks. Source Tech isn’t a player at all. Embross is only airlines and Lilitab is iPad tablets. Intuiface is software and Slabb only does micro markets (though they want to expand that.).
- Pretty misleading report all around. You should recommend to your competitors.
- KioskMarketplace 2023 – Their number is $14.52 but no indication how they came up with that. In the past surveys of vendors, 200 or less, is the sample survey crowd. Chicken bones at midnight in the parking lot and copy of account receivables is our guess. In 2022, the recovery gained momentum, delivering $14.52 billion in global sales of interactive kiosks, not counting ATMs and refreshment vending machines, a 20% gain over the $12.1 billion in 2021, and a 6-point increase over the prior one-year gain, according to the 2023 Kiosk Marketplace Census.
- TechNavio – $8B in 2027. CAGR = 12.6% — Looks like usual internet scrape/reformat. 20 companies profiled including Zivelo who went out of business 5 years ago. Some lockers and micromarket companies. Out of 10 stars we give it 3 stars. — Link
- The global digital signage market size is expected to grow from USD 20.40 billion in 2021 to USD 36.89 billion by 2028; it is estimated to record a CAGR of 8.8% from 2022 to 2028. From Yahoo
- The digital wayfinding solutions market is projected to reach US$ 665.0 million by 2028 from US$ 234.6 million in 2021; it is expected to grow at a CAGR of 16.0% from 2021 to 2028. The key companies operating in the digital wayfinding solutions market and profiled in the report include 22 Miles, Inc.; Acquire Digital; Click Grafix; ConnectedSign; Gozio Inc.; Jarma Technologies LLC; LamasaTech Ltd; Ping HD; TrouDigital; Visix, Inc.; Xtreme Media Pvt. Ltd.; Everbridge Inc.; and Digital Wayfinding Solution (Advertise Me Pty Ltd). ReportLinker — Moreover, 22Miles offers 3D interactive navigation for touchscreens, video walls, and mobile devices, along with intelligent routing, for any audience or setting. Thus, the popularity of interactive wayfinding software is expected to drive the demand for digital wayfinding solutions market during the forecast period.
- Rankings of the Top 50 food and grocery retailers and wholesalers in the U.S. and Canada, including supermarkets, mass merchandisers, dollar stores, convenience stores and drugstores. Sales figures are based on reports from public retail companies and, in cases of privately owned companies, IGD estimates. Amazon almost as large as Kroger and Costco combined. +43% change (8% typical)
- Digital Delivery Report 2022 — Order & Delivery report examines industry trends across the digital ordering landscape, from multiunit brands to independent restaurants
and c-stores. The primary areas of focus are sales, guest experience, fulfillment method, and guest retention. — Paytronix Order And Delivery Report 2022-compressed - Forbes — In 2019 survey, 65% of customers said they would be more willing to visit a restaurant if self-service kiosks were available.
- Benefits — When they can enter their own order specifications and send them directly to the kitchen, accuracy and speed of service are increased, resulting in higher customer satisfaction. Furthermore, they are likely to spend more: ticket sizes, on average, are 12%-20% higher when ordering from a self-service kiosk rather than a cashier, and some restaurants report increases as high as 30%. Forbes and Modern Restaurant Management
- Staffing — Kiosks may also be crucial to filling gaps created by the labor shortage. According to an April 2021 survey by the National Restaurant Association, 84% of operators said their staffing was lower than required.
- 66% of consumers prefer self-service over interacting with an employee because it is faster and less stressful. [Palmer Retail]
- Payment Options: 29% of consumers prefer contactless payments such as mobile wallets, contactless payment kiosks, and QR code payments.
- “According to a recent study on checkout lines, 69 percent of shoppers said long lines were the most irritating part of shopping,” Rob Meiner with Peerless-AV said. “That beat out high prices (66 percent) and inventory being out of stock (65 percent). Eighty-four percent of those customers said watching digital displays helped them pass the time while they waited.
- IHL Growth Numbers 2021
kiosk market research 2019 numbers
- Self-Checkout 178%
- Consumer Mobile Checkout 300%
- Contactless Payment 190%
- Electronic Shelf Labels 600%
- Dark Stores 900%
- Before listing out market reports, bear in mind that most of the reports will include supermarket and even ATM segments (e.g. NCR or Diebold Nixdorf). NCR is $40B company and does hybrid checkout “kiosks” for Walmart. The Kiosk Association report filtered out double-counting and non-relevant units.
- Data Mart Market Reports (Pick your poison – red is for appears to be internet generated)
- 2025 August Research and Markets — 44B growing to 64B — still stuck on SCO Self-Checkout for most part.
- SNS Insider 2024 (Pune) — Note that these people INCLUDE ATMs in their market. 50% of their number. As per the SNS Insider Report, “The Interactive Kiosk Market was valued at USD 32.18 Billion in 2023 and is expected to reach USD 64.51 Billion by 2032, growing at a CAGR of 8.05% over the forecast period 2024-2032.”
- Medical kiosk market Feb 2024 — here is our review
- Jun 9 – ResearchAndMarkets — 40B now and 63B in 2027 — ATMs, Vending and Kiosks. 14 companies listed. Only 4 full kiosk manufacturers. No ATM manufacturers.
- ResearchAndMarkets Poised to grow by $ 3.33 bn during 2022-2026 progressing at a CAGR of 6.05% during the forecast period. April 22 — Report Linker and ResearchandMarkets
- ResearchAndMarkets 10.397B in 2026 – Research and Markets Self-Service Ticket Machines (they resell reports from market data report generators – this one has some very unusual companies listed. Feb 2022. Usual non-relevant names and minor producers.
- 7.9% CAGR – Research & Markets Interactive Display Market – October 2021
- 52.74M USD by 2030, registering a CAGR of 7.1% over the forecast period. ReportLinker
- 12.1B interactive kiosk sales KMC 2022 Census (11.9 in 2019). There was no quoted source for those numbers. – did not include ATMs or refreshment vending machines [based on 300 questionnaires to readers]
- 4.6B in 2026 – U.S. market for self-service kiosks should grow from $2.4 billion in 2021 to $4.6 billion by 2026 with a compound annual growth rate (CAGR) of 13.6% for the period of 2021-2026. This is 2022 report by BCC Research
- 2017 — 8.9B in 2017 – Frost & Sullivan
- 2022 — 10.3B in 2022 – Frost & Sullivan
- 2021 — R&M put it at 2.4B
- 2.8B in 2022 and 4.4B by 2025 — SS KMA report
- 8.9B Revenue – Frost — The self-service kiosks market had a revenue of $8,916.8 million and registered total shipments of 2,277,523 units in 2017.
- 36B by 2027 – Global Interactive Kiosk Market to reach USD 35.9 billion by 2027. Global Interactive Kiosk Market is valued approximately at USD 25.0 billion in 2019 and is anticipated to grow with a CAGR of more than 4.6% over the forecast period 2020-2027. [MarketStudyReport]
- 32B by 2027 – The global interactive kiosk market size was valued at $14.76 billion in 2018, and is projected to reach $32.51 billion by 2027, growing at a CAGR of 9.1% from 2020 to 2027. [Allied]
- 22B by 2021 – The global kiosk market is projected to grow from $22.69 billion in 2021 to $51.05 billion in 2028 at a CAGR of 12.3% in forecast period [2021-2028] [Fortune]
- 21B by 2027 – The self-service kiosk market is US $11,319 million in 2019 and it is projected to reach US $21,415.4 million by 2027. [ResearchAndMarkets]
- 36B by 2026 – The global Self Service Kiosk Market is estimated to surpass $35.8 billion mark by 2026 growing at an estimated CAGR of more than 6.4% [IndustryArc]
- 26B by 2020 – The global interactive kiosk market size was valued at USD 26.63 billion in 2020 and is expected to expand at a compound annual growth rate (CAGR) of 6.9% from 2021 to 2028. [Grandview]
- 21B by 2027 – Self-Service Kiosk Market Growth Sturdy at 8.6% CAGR to Outstrip $21B by 2027 [Insight Partners]
- 45B by 2028 — The global interactive kiosk market size is expected to reach USD 45.32 billion by 2028. It is expected to expand at a CAGR of 6.9% from 2021 to 2028. [Report Linked]
- CredibleMarkets August 2021 — typical “not credible” report listing out usual internet suspects
- 28 Billion by 2022 — The global self-service kiosk market is estimated to value USD 28 Bn in 2022 and reach USD 79.5 Bn by 2032. The projected CAGR of the market is 11% during the forecast period from 2022 to 2032.
- KMA industry report — U.S market for self-service kiosks was valued at $2.6 billion in 2019. It is projected the self-service kiosks market in the U.S. will grow at a CAGR of 16.1% to reach $4.4 billion by 2025. [Kiosk Association 2019]
- Here is story on Chick-Fil-A and virtual order takers in the drive thru (TikTok video) — link
- Canadian organizations are taking a broad, strategic view of their kiosk investments, saying the number one business driver is to support their digital transformation, with 77% saying the technology will be important or very important in the next five years. [CDN
Kiosk Related Data
- Square
- 73% of restaurants say they are experiencing a labor shortage.
- Restaurants say that an average of 21% of positions are unfilled.
- In 2021 36% of restaurants upgraded business technology this past year.
- 62% of restaurants say that automation would fill critical gaps in managing orders placed online, at the restaurant, and via delivery apps.
- Restaurants that offer online ordering say that an average of 34% of their revenue currently comes from those channels.
- 49% of restaurants say that they plan to offer first-party delivery, while 62% say that they plan to offer third-party delivery.
- Restaurants are able to turn tables faster, and recent Square data show that businesses average a 35% increase in sales within the first 30 days after they implement self-serve ordering with QR codes.
- 79% of customers say that they’d prefer to order via online kiosks rather than directly through staff — and not just for fast food.
- 45% of customers prefer it for casual dining
- 21% prefer it for fine dining.
- Payment Options: 29% of consumers prefer contactless payments such as mobile wallets, contactless payment kiosks, and QR code payments.
Signage related data
- Square
- 78% of customers say that there are benefits to digital menus.
- 11% of customers would avoid a restaurant with no digital menus.
- 45% of restaurants say that they plan to offer QR code menus even after COVID subsides.
- Digital menus help communicate fluctuating prices and lessen the workload of printing new menus constantly. And 77% of customers say that they would understand if their favorite local restaurants raised prices.
Ordering Payment related data
- Kiosks can accept a variety of payments, and customers gain peace of mind because their credit or debit card never leaves their possession. Kiosks can also efficiently accommodate tasks such as splitting the bill (and in a 2015 survey, 75% of customers rated the ability to split the bill as their most desired self-payment feature).
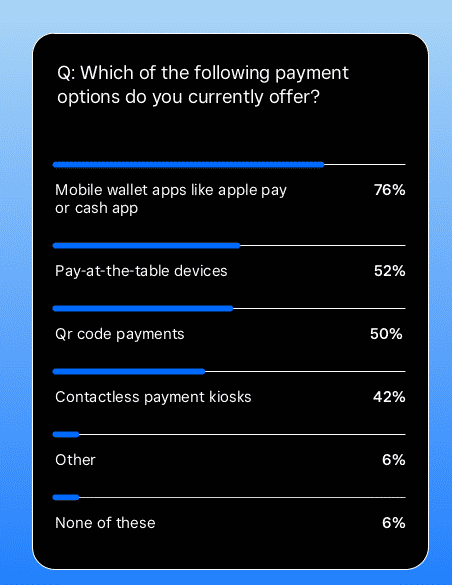
Which Payment Options Offered?
- 94% of restaurants surveyed say that they currently offer contactless payment options.
- Which of the following payment options do you currently offer?
- Mobile wallet apps like apple pay or cash app 76%
- Pay-at-the-table devices 52%
- Qr code payments 50%
- Contactless payment kiosks 42%
- Other 6%
- None of these 6%
- Additionally, 52% of restaurants surveyed say that they plan to offer tableside payment options.
- 43% of millennial and Gen Z diners prefer contactless payment methods.
- 29% of consumers prefer contactless payments such as mobile wallets, contactless payment kiosks, and QR code payments.
- 18% of customers say they are interested in shopping via text or chat; among Gen Z consumers, that number jumps to 25%.
- According to the 2021 Findings from the Diary of Consumer Payment Choice, cash use in the U.S. accounted for only 19 percent of all payments in 2020, 7 percent less than in 2019.
- Among customers, 20% are interested in window shopping with QR codes for purchases; among Millennials, that number jumps to 27%.
- POS data infographic by Datacap Systems is recommended for context
- According to a 2021 Fundera by NerdWallet study, 80% of consumers prefer to pay with a card.
Retail Data
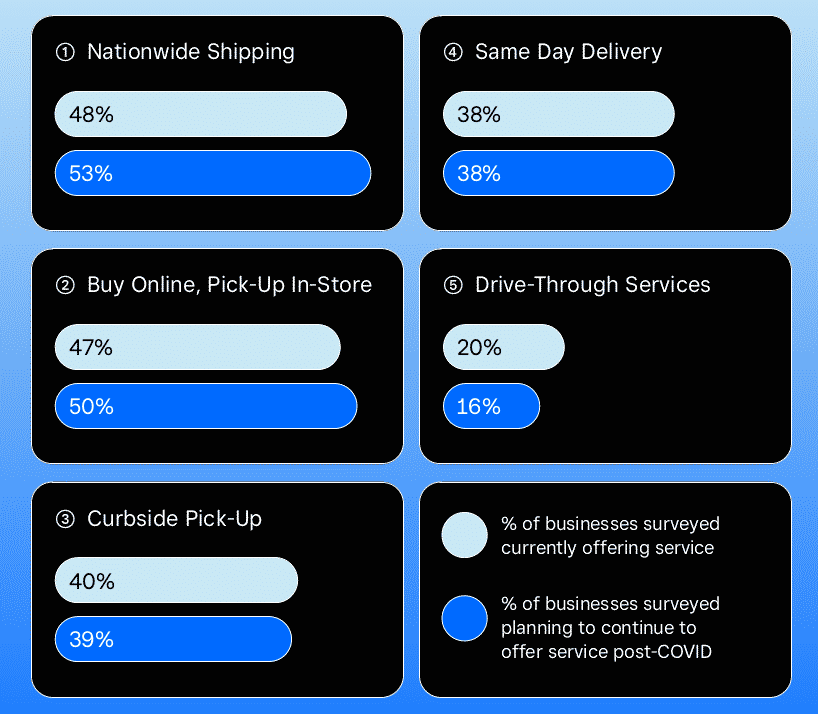
Retail Services Currently Offered
- 32% of retailers say that not knowing enough about technology options/ platforms keeps them from selling goods through newer online or social channels.
- 28% of retailers say they have seen customers purchasing gift cards over the past year.
- Retailers using eCommerce report that an average of 58% of their revenue currently comes from online sales.
- 84% of customers say measures put in place to make shopping a more contactless experience have made shopping more enjoyable.
- 18% of customers say they are interested in shopping via text or chat; among Gen Z consumers, that number jumps to 25%.
- Among retailers who sell online, 74% say they sell on a social channel.
- Facebook 59%
- Instagram 34%
- Twitter 28%
- TikTok 18%
- December 2021 — TikTok overtakes Google for 2021 Traffic Ratings [link]
- Among customers, 20% are interested in window shopping with QR codes for purchases; among Millennials, that number jumps to 27%.
- McKinsey – In total, self-checkout solutions in the Retail Environments setting could generate $430 billion to $520 billion in economic value in 2030, with more
than 80 percent of the value coming from cost reductions in the store and 20 percent from increased consumer surplus for shoppers, primarily from spending less time shopping. Adoption of self-checkout use cases is expected to increase from a relatively low 15 to 35 percent of organized retail today to 80 to 90 percent in 2030. - McKinsey – Retailers report that self-checkout is the fastest growing application of the IoT. Over the next two years, adoption by large retail chains of self-heckout
systems could exceed 50 percent. - US Retail has added more sales in 2021 than the entire retail economy for India. The growth…in 2021 through 11 months is $831b USD….for 2020, the entire retail economy for nearly 1.4b people was $814b USD for the year! The growth for November alone?…$91.1b USD…. That’s the total revenue for 2020 for Lowe’s…and just short of Target’s 2020 revenues just north of $93b. [IHL]
- Total retail growth year to year is 18.2%…that’s a $5.5 trillion market growing at 18.2% for the year. And for the month…20.3%. Even taking out C-stores and Gas Stations… the growth was 16.5%. The growth last month?…16.1%…so the growth is accelerating, not slowing. [IHL]
- Add to this that Gift Cards are up 414% for the holiday season and consumers generally spend 25% more than their gift card value when redeemed thus extending the holiday season. [IHL]
Four tips for SMS marketing
Telehealth Data
- The number of Medicare fee-for-service (FFS) beneficiary telehealth visits increased 63-fold in 2020, from approximately 840,000 in 2019 to nearly 52.7 million in 2020. [HHS]
- Visits to behavioral health specialists showed the largest increase in telehealth in 2020. Telehealth comprised a third of total visits to behavioral health specialists. [HHS]
Hospitality
Highlights from 2022 Lodging Technology Study include:
- 74% of hotels either offer or plan to offer contactless payment
- 45% plan to add, upgrade, or switch vendors for revenue management (RMS)
- 36% plan to add, upgrade, or switch vendors for a chatbot solution
- 30% of IT budgets are allocated for rolling out and implementing new solutions
Restaurant Market Trend Data
From Chain Store Age 1/4/2022 — According to the survey, restaurant operators’ early investment in delivery and mobile ordering has paid off, with 71% relying on delivery for 11% or more of sales and 33% relying on delivery for more than 20% of sales. Sixty-five percent of respondents rely on mobile ordering for 11% or more of sales, and 25% rely on mobile ordering for more than 20% of sales.
To keep up with changing consumer preferences, operators noted that their top areas of investment in 2022 include mobile ordering (54%); delivery services (47%); technology such as new POS digital signage or other in-store tech (45%); and alternative payment methods (37%).
In addition to technological investments, operators are also altering their physical restaurant locations to cater to delivery. While only 15% plan to reduce the number or size of their franchise locations, operators are making other adjustments to their real estate. These include
- 55% plan to add more space for pick-up;
- 45% plan to provide additional drive-thru locations; and
- 43% plan to add an outdoor on-site dining space.
Despite the challenges the restaurant industry has faced since the start of the pandemic, operators have learned to pivot and as a result, 81% of respondents feel optimistic about the future. More than half even feel very optimistic and 47% believe their revenue will increase significantly. This optimism and operators’ planned investment lead to strong credit needs. In fact, 61% of respondents plan to apply for a loan or line of credit within the next year.
This study was conducted among a representative group of 251 restaurant franchise owners and operators across the United States from November 10-22, 2021. The survey was hosted by global research company Engine Insights.
More Data
- Among customers, 23% are interested in virtual reality that allows people to experience products in a virtual shop; among Millennials, that number jumps to 33%.
- 21% are interested in live stream shopping where a host demonstrates a product in a live online video; among Millennials, that number jumps to 35%.
- Strategy Analytics estimates that the sale of personal service robots will grow about 30 percent year over year, rising from 39 million units in 2020 to 146 million units in 2025.
- Livestreaming – Interest in this emerging retail channel is highest among global consumers between the ages of 21 and 34, peaking with the 30–34 age group with 46% having used this medium to make a purchase. As a nation, China is leading with 63% having made a purchase in the last month. Source: Euromonitor International Voice of Consumer: Digital Survey, fielded in March 2021 according to the Voice of the Consumer:Digital Survey.
References:
- The Square Consumer Survey was conducted by Wakefield Research among 1,000 nationally representative U.S. adults ages 18+, between October 6th and October 17th, 2021, using an email invitation and an online survey. The data was weighted to ensure reliable and accurate representation of the U.S. adult population, ages 18+. The Square Retail Survey was conducted by Wakefield Research among 500 U.S. retail owners and managers, between October 6th and October 17th, 2021, using an email invitation and an online survey.
- Forrester Research — Before we get into 2022, how accurate were we in 2021 predictions? [link]
- Who Got It Right in 2021 — A look back
- 2021 HHS medicare-telehealth-report
- IHL Retail Numbers December 2021
- Datacap Infographic
- TouchDynamic Article
Related Kiosk Market Research Posts
- Kiosk Research – Global Self-Service Tech Market on the Rise(Opens in a new browser tab)
- Five Payment Trends in 2021 – Appetize Technologies(Opens in a new browser tab)
- The Do-It-Myself Generation | NACS Online(Opens in a new browser tab)
For more information contact craig@catareno.com or call 720-324-1837


