Last Updated on April 1, 2026 by Craig Allen Keefner
Unbanked Underbanked Stats
The unbanked and underbanked, what to do with them? Calculating the use of cash, credit cards (credit or debit), checks and e-wallets is not a simple equation. A drive thru in a small city in Alabama is going to be different than high end retail store in downtown Chicago.
Seeing how the size of transactions impacts which currency is used is another variable. Large transactions are going to be credit as a rule. A cup of coffee at McDonalds is a buck.
So the dollar value of transactions is a variable as well. If 90% of your sales is via credit card then you favor credit card. 90% of your sales might be 40% of your transactions though.
It gets complicated.
Cash Decline unbanked underbanked
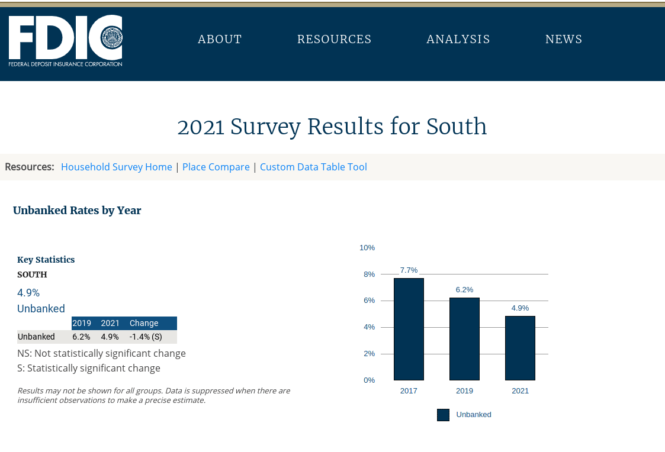
fdic unbanked underbanked
Excerpt: The FDIC is committed to expanding Americans’ access to safe, secure, and affordable banking services, which is integral to the FDIC’s mission of maintaining the stability of and public confidence in the U.S. financial system. The FDIC National Survey of Unbanked and Underbanked Households is one contribution to this end. Conducted biennially since 2009 partly in response to a statutory mandate, the survey is administered in partnership with the U.S. Census Bureau and collects information on bank account ownership; use of prepaid cards and nonbank online payment services; use of nonbank money orders, check cashing, and money transfer services; and use of bank and nonbank credit.
Video
More Information
Key Unbanked Underbanked Findings
-
National Unbanked Rate
- An estimated 4.5 percent of U.S. households (approximately 5.9 million) were “unbanked” in 2021, meaning that no one in the household had a checking or savings account at a bank or credit union.
- The unbanked rate in 2021—4.5 percent—was the lowest since the survey began in 2009. Between 2019 and 2021, the unbanked rate fell 0.9 percentage points, corresponding to an increase of approximately 1.2 million banked households.
- Between 2011—when the unbanked rate was at its highest level since the survey began—and 2021, the unbanked rate fell 3.7 percentage points, corresponding to an increase of approximately 5.0 million banked households.
-
Unbanked Rates by Household Characteristics
- Consistent with the results of previous surveys, unbanked rates in 2021 varied considerably across the U.S. population. For example, unbanked rates were higher among lower-income households, less-educated households, Black households, Hispanic households, working-age households with a disability, and single-mother households.
- Differences in unbanked rates between Black and White households and between Hispanic and White households in 2021 were present at every income level. For example, among households with income between $30,000 and $50,000, 8.0 percent of Black households and 8.4 percent of Hispanic households were unbanked, compared with 1.7 percent of White households.
- Consistent with the results of previous surveys, unbanked rates in 2021 varied considerably across the U.S. population. For example, unbanked rates were higher among lower-income households, less-educated households, Black households, Hispanic households, working-age households with a disability, and single-mother households.
-
Unbanked Households: Reasons for Not Having a Bank Account
- “Don’t have enough money to meet minimum balance requirements” was cited by 21.7 percent of unbanked households as the main reason for not having an account—the most cited main reason.
- “Don’t trust banks” was the second-most cited main reason for not having an account in 2021 (13.2 percent), and “Avoiding a bank gives more privacy” was the third-most cited main reason (8.4 percent).
-
COVID-19 Pandemic and Transitions in Bank Account Ownership
- New questions in the 2021 survey asked households whether they experienced economic changes since the start of the COVID-19 pandemic in March 2020 and whether those changes contributed to the closing or opening of households’ bank accounts.
- About one in three (34.9 percent) recently banked households reported that receiving a government benefit payment (for example, unemployment benefits or a pandemic stimulus payment) contributed to opening a bank account since March 2020.
- In other words, among the 77.9 percent of recently banked households that received a government benefit payment, almost half (44.8 percent)—representing approximately 1.9 million households—said that the payment contributed to opening an account.
- About one in five (21.1 percent) recently unbanked households reported that losing or quitting a job, being furloughed, having reduced hours, or having a significant loss of income contributed to closing a bank account since March 2020.
- About one in three (34.9 percent) recently banked households reported that receiving a government benefit payment (for example, unemployment benefits or a pandemic stimulus payment) contributed to opening a bank account since March 2020.
- New questions in the 2021 survey asked households whether they experienced economic changes since the start of the COVID-19 pandemic in March 2020 and whether those changes contributed to the closing or opening of households’ bank accounts.
-
Banked Households: Primary Method Used to Access Bank Accounts
- Among banked households:
- Use of mobile banking increased sharply (from 15.1 percent in 2017 to 34.0 percent in 2019 to 43.5 percent in 2021) and remained the most prevalent primary method of account access.
- Use of a bank teller declined considerably (from 24.8 percent in 2017 to 21.0 percent in 2019 to 14.9 percent in 2021) but remained prevalent among certain segments of the population, including lower-income households, less-educated households, older households, and households that did not live in a metropolitan area.
- Among banked households:
-
Prepaid Cards and Nonbank Online Payment Services
- In 2021, 6.9 percent of all households were using general purpose reloadable prepaid cards at the time of the survey, and 46.4 percent of all households were using nonbank online payment services. Examples of nonbank online payment services are PayPal, Venmo, and Cash App.
- Use of prepaid cards was much higher among unbanked households (32.8 percent) than among banked households (5.7 percent).
- Use of nonbank online payment services was much lower among unbanked households (18.1 percent) than among banked households (47.7 percent).
- Unbanked households were twice as likely to use prepaid cards or nonbank online payment services to conduct four or more types of transactions compared with banked households.
- In 2021, 6.9 percent of all households were using general purpose reloadable prepaid cards at the time of the survey, and 46.4 percent of all households were using nonbank online payment services. Examples of nonbank online payment services are PayPal, Venmo, and Cash App.
-
Nonbank Money Orders, Check Cashing, and Money Transfer Services
- Use of nonbank money orders and nonbank check cashing declined steadily between 2017 and 2021.
- In 2021, 9.7 percent of all households used nonbank money orders, down from 14.3 percent in 2017 and 11.9 percent in 2019.
- In 2021, 3.2 percent of all households used nonbank check cashing, down from 6.4 percent in 2017 and 5.5 percent in 2019.
- In 2021, 7.0 percent of all households used nonbank money transfer services from companies like Western Union, MoneyGram, Walmart Money Center, or Ria Money Transfer.
- Use of nonbank money orders and nonbank check cashing declined steadily between 2017 and 2021.
-
Bank and Nonbank Credit
- In 2021, 71.5 percent of households had a Visa, MasterCard, American Express, or Discover credit card (i.e., a credit card), similar to the proportion in 2019 (71.3 percent) and above the 2017 level (68.5 percent). The share of households that had a personal loan or line of credit from a bank (i.e., a bank personal loan) decreased from 10.8 percent in 2019 to 8.0 percent in 2021. Altogether, 72.5 percent of households in 2019 and 72.3 percent of households in 2021 had a credit card or bank personal loan. In addition, 2.8 percent of households had a personal loan or line of credit from a company other than a bank (i.e. a nonbank personal loan) in 2021.
- Differences by race and ethnicity in the likelihood of having a credit card or bank personal loan were present at every income level. For example, even among households with income between $50,000 and $75,000, 64.8 percent of Black households and 71.2 percent of Hispanic households had a credit card or bank personal loan, whereas 81.3 percent of White households did so.
- Use of rent-to-own services and payday, pawn shop, tax refund anticipation, and auto title loans all decreased between 2017 and 2021. About 1 percent of households in 2021 used each product or service. The proportion of households that used at least one of the five products or services declined sharply from 7.4 percent in 2017, to 4.8 percent in 2019, and to 4.4 percent in 2021.
- The proportion of unbanked households that used at least one of the five products or services decreased substantially between 2017 and 2021. Despite this decline, use of these nonbank credit products or services in 2021 continued to be more prevalent among unbanked households than among banked households.
- In 2021, 71.5 percent of households had a Visa, MasterCard, American Express, or Discover credit card (i.e., a credit card), similar to the proportion in 2019 (71.3 percent) and above the 2017 level (68.5 percent). The share of households that had a personal loan or line of credit from a bank (i.e., a bank personal loan) decreased from 10.8 percent in 2019 to 8.0 percent in 2021. Altogether, 72.5 percent of households in 2019 and 72.3 percent of households in 2021 had a credit card or bank personal loan. In addition, 2.8 percent of households had a personal loan or line of credit from a company other than a bank (i.e. a nonbank personal loan) in 2021.
-
Underbanked Households
- An estimated 14.1 percent of U.S. households (approximately 18.7 million) were “underbanked” in 2021, meaning that the household was banked and in the past 12 months used at least one of the following nonbank transaction or credit products or services that are disproportionately used by unbanked households to meet their transaction and credit needs:
- Money orders, check cashing, or international remittances (i.e., nonbank transactions) or
- Rent-to-own services or payday, pawn shop, tax refund anticipation, or auto title loans (i.e., nonbank credit).
- An estimated 81.5 percent of U.S. households (approximately 107.9 million) were “fully banked” in 2021, meaning that the household was banked and in the past 12 months did not use any of the above nonbank transactions and credit.
- As the primary method of bank account access, use of mobile banking was higher among underbanked households (48.8 percent) than among fully banked households (42.5 percent). Use of online banking as the primary method of account access was much lower among underbanked households (11.6 percent) than among fully banked households (23.8 percent). Similar proportions of underbanked households (15.0 percent) and fully banked households (14.9 percent) used a bank teller as the primary method of account access.
- Almost all underbanked households (96.1 percent) and fully banked households (97.3 percent) used their bank accounts to pay bills or receive income. However, while 81.6 percent of fully banked households exclusively used their bank accounts to conduct these transactions, only 38.1 percent of underbanked households did so.
- Underbanked households were less likely to have a credit card and were more likely to have both bank and nonbank personal loans than fully banked households in 2021. For example, 62.4 percent of underbanked households had a credit card, compared with 76.6 percent of fully banked households. One in ten underbanked households (10.0 percent) had a bank personal loan, compared with 8.0 percent of fully banked households. And 5.6 percent of underbanked households had a nonbank personal loan, compared with 2.4 percent of fully banked households.
- An estimated 14.1 percent of U.S. households (approximately 18.7 million) were “underbanked” in 2021, meaning that the household was banked and in the past 12 months used at least one of the following nonbank transaction or credit products or services that are disproportionately used by unbanked households to meet their transaction and credit needs:
Implications
The financial disruptions due to the COVID-19 pandemic created unique opportunities and challenges for economic inclusion, some of which may be temporary, while others may be longer lasting. The importance of quickly receiving income from Economic Impact Payments or other government relief programs created a unique bankable moment, and consumers benefitted from enhanced online and mobile account opening technologies and the greater availability of safe and affordable bank accounts. This combination of factors resulted in meaningful gains in connecting households to the banking system.
Health and safety concerns regarding in-person interactions during the pandemic may have accelerated the long-term trend of increasing use of mobile and online channels to access financial products and services, such as mobile banking and online payment services. As the pandemic wanes, it will be important to carefully monitor whether the shift from in-person activity continues, stabilizes, or subsides.
Beyond impacts directly tied to the pandemic, the financial services marketplace continues to become more disaggregated, and consumers are bundling services and providers (bank and nonbank) in new and interesting ways. This disaggregation may provide greater choices for consumers but also may make it more difficult for consumers to clearly distinguish differences between bank and nonbank products and to understand the protections available, such as deposit insurance. The economic inclusion implications of disaggregation on different segments of the population bear further research and highlight the need to learn more about how consumers are navigating the choices presented to them by the evolving marketplace.
 Despite economic challenges posed by the pandemic, more consumers became banked and sustained their banking relationship through financial distress. The importance of quickly receiving government payments contributed to decisions by many unbanked consumers to open bank accounts. Focusing on opportunities to connect consumers to safe and affordable bank accounts when they are receiving income and other government payments continues to be a promising economic inclusion strategy. Enhancements to online account opening technology deployed during the pandemic and the increased availability of low-cost accounts in recent years also may facilitate these banking efforts. Disruptions in income had a smaller impact in exits from the banking system than previous survey results might suggest, and further research is needed to explore the reasons for this smaller than expected impact, including strategies banks used to assist low- and moderate-income (LMI) consumers navigate short-term financial shocks.
Household use of some nonbank financial services, such as check cashing and certain consumer credit products, has declined significantly over the past decade. A combination of factors may be driving these trends, including reduced demand from changing needs, increased participation in the banking system, or the increasing supply of other, new nonbank products and services, many of which can be found online or through mobile applications. Much remains to be learned about consumer choices and the factors that are motivating them. Additional research into these choices and motivations is vital to ensuring that economic inclusion efforts evolve to address consumers’ changing needs and preferences.
While many banked households appear to use nonbank online payment services such as PayPal, Venmo, and Cash App to complement banking products, unbanked households may be using them as substitutes for banking or other financial services. These use cases have different economic inclusion implications but highlight that it is important for all consumers to understand limits and applicability of consumer protections, especially deposit insurance.
2021 Survey Results
All PDF files on this page reference Portable Document Format (PDF) files. Adobe Acrobat, a reader available for free on the Internet, is required to display or print PDF files. (PDF Help)
- 2021 Executive Summary – PDF
- 2021 Report – PDF
- 2021 Appendix Tables – PDF
- 2021 Technical Notes and Survey Revisions – PDF
- 2021 Instrument – PDF
More Resources
- 2022 findings from the Diary of Consumer Payment Choice — On May 5, 2022, the Federal Reserve Bank of San Francisco’s FedNotes (Off-site) publication featured an article entitled, “2022 Findings from the Diary of Consumer Payment Choice (Off-site)” written by Emily Cubides and Shaun O’Brien. We are sharing a reprint of the article, which describes results from a survey of a demographically representative sample of U.S. consumers.
- The Fed – Developments in Noncash Payments for 2019 and 2020: Findings from the Federal Reserve Payments Study — The Federal Reserve Payments Study (FRPS) collects data to document trends and developments in U.S. payments. This brief is the first report since the detailed release of 2018 data. It provides new findings for 2019 and 2020, the latter year reflecting effects of the global COVID-19 pandemic, on payments processed over general-purpose credit and debit card networks, including non-prepaid and prepaid debit card networks; the automated clearinghouse (ACH) transfer system; and the check clearing system. These payment systems—card, ACH, and check—form the core of the noncash payment and settlement systems used to clear and settle everyday payments made by consumers and businesses in the United States today. Results include estimates of payment shares based on information collected from large depository institutions in the Depository and Financial Institutions Payments Survey (DFIPS). Results also include nationally representative totals for cards from the Networks, Processors, and Issuers Payments Surveys (NPIPS).
- Debit card statistics – CreditCards.com — The COVID-19 crisis was easily the greatest economic disruption since the Second World War and perhaps even the Great Depression. While there were certainly some winners and some losers, the crisis affected nearly every aspect of our economy, and we are only just now beginning to recover. As we recover, it’s still unclear how our usage of debit cards has been affected.
2024 UnBackground and Commentary
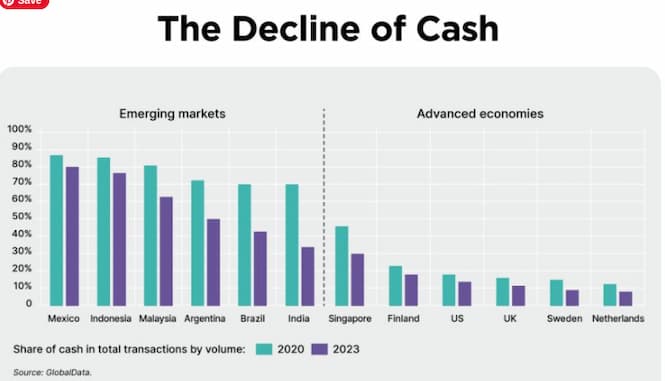
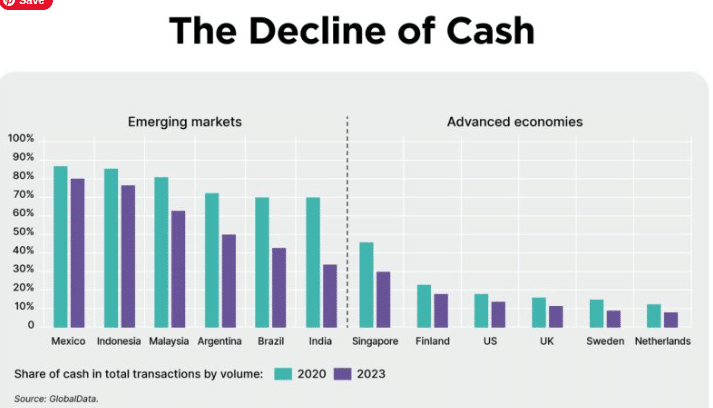
In a cashless world, who gets left behind?
Many people are still left behind when it comes to financial inclusion in digital payments. As cash usage declines, they may become increasingly excluded.
Figure 3 shows this decline in cash clearly, both in emerging markets and developed economies, with some countries already becoming almost fully cashless.
Not everyone has the same definition of cashless. Some see it as simply meaning that you always have the option to make any payment digitally, and this may well become a reality in the near future. Some see it as the full elimination of physical cash from society – with no more hard currency being issued by central banks and no possibility to pay non-digitally. This may seem
unlikely in the near future but, given the dramatic digitisation of payments over the last 40 years, it still seems possible that this could occur in some countries in the next 10-20 years.
The downsides and costs of cash, have led to major government-led Alternative Payment Methods (APMs) in an effort to reduce cash usage. In India for instance, UPI (Unified Payments Interface), since its launch in 2016, has grown to process over 7.82 billion transactions in Dec 2022. Whilst in Brazil, Pix has taken just two years to become the payment means most used by Brazilians. These APMs are not only used by people buying from merchants, but also to pay each other in person-toperson (P2P) payments, further eroding the use of cash.
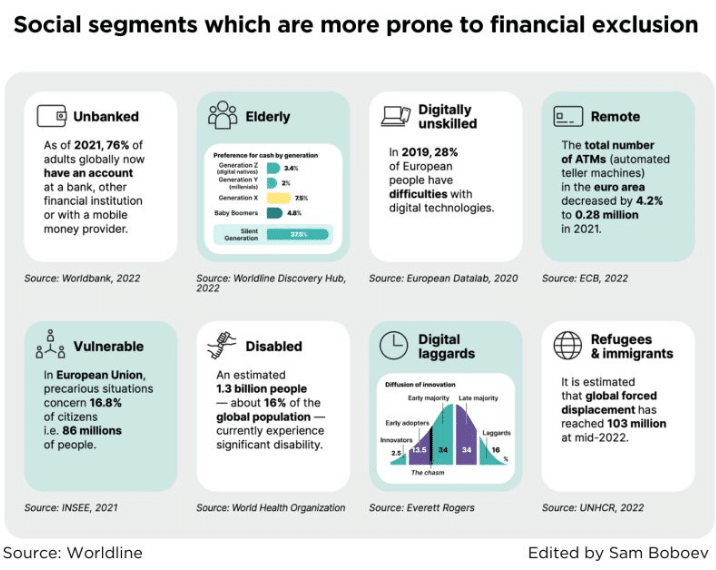
How digital financial exclusion impacts citizens
As illustrated above, social segments which are more prone to financial exclusion are people who are unbanked, elderly, digitally unskilled, living in remote locations, vulnerable, disabled, refugees and immigrants, and digital laggards.
Through their dependence on cash, they can face various difficulties:
• The poverty premium: In the UK, “People without bank accounts are deprived of discounted prices connected to direct debit payments.”
• Reduced convenience: Extra time is needed to obtain or deposit cash because there can be a lack of ATMs/ bank branches, while some retailers no longer accept cash at all.
• Security risks: The risk of cash being stolen or counterfeiting (US retail businesses lost about $40 billion in 2014 because of the theft of cash alone14 and, in Germany, thieves are now “blowing ATMs up at a rate of more than one a day”).
• Social divide: A reduced ability to access and pay for digital-only services may deepen inequality, as explained in the OECD report Advancing the Digital Financial Inclusion of Youth.
• Depreciation: Savings held as cash do not earn interest and therefore will not resist devaluation over time.
• Affordable borrowing: Lending from the unstructured sector tends to come with significantly higher interest rates than from the structured sector.
Subscribe https://lnkd.in/gcWnV_AC
Source Worldline